

276
M. Kryza et al.
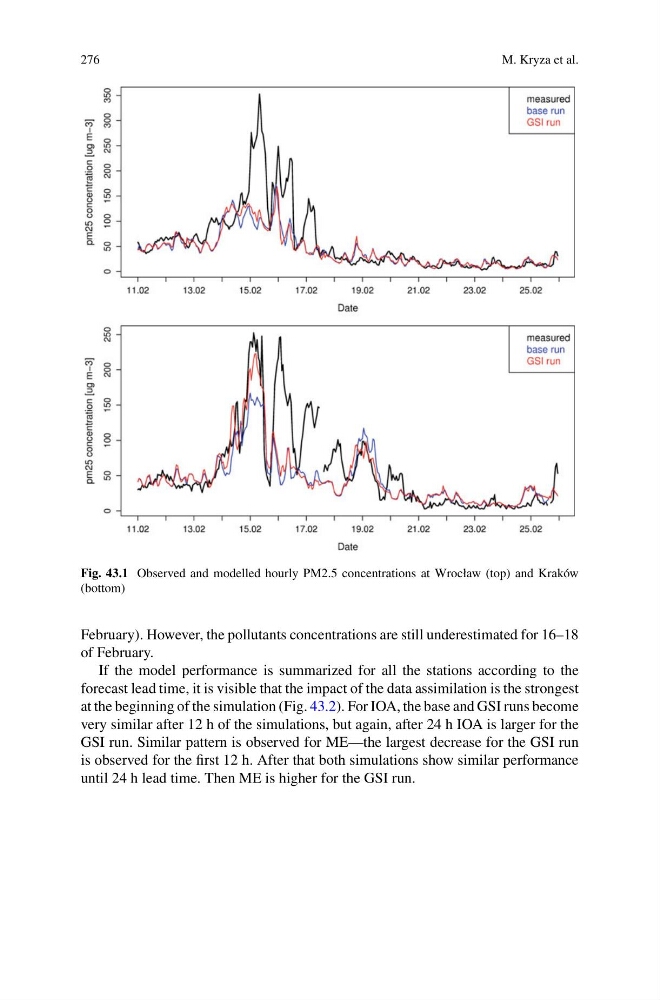
Fig. 43.1 Observed and modelled hourly PM2.5 concentrations at Wrocław (top) and Kraków
(bottom)
February). However, the pollutants concentrations are still underestimated for 16–18
of February.
If the model performance is summarized for all the stations according to the
forecast lead time, it is visible that the impact of the data assimilation is the strongest
at the beginning of the simulation (Fig. 43.2). For IOA, the base and GSI runs become
very similar after 12 h of the simulations, but again, after 24 h IOA is larger for the
GSI run. Similar pattern is observed for ME—the largest decrease for the GSI run
is observed for the first 12 h. After that both simulations show similar performance
until 24 h lead time. Then ME is higher for the GSI run.
M. Kryza et al.
Fig. 43.1 Observed and modelled hourly PM2.5 concentrations at Wrocław (top) and Kraków
(bottom)
February). However, the pollutants concentrations are still underestimated for 16–18
of February.
If the model performance is summarized for all the stations according to the
forecast lead time, it is visible that the impact of the data assimilation is the strongest
at the beginning of the simulation (Fig. 43.2). For IOA, the base and GSI runs become
very similar after 12 h of the simulations, but again, after 24 h IOA is larger for the
GSI run. Similar pattern is observed for ME—the largest decrease for the GSI run
is observed for the first 12 h. After that both simulations show similar performance
until 24 h lead time. Then ME is higher for the GSI run.