

43 Assimilation of Meteorological Data in Online …
275
model forecasts, the initial conditions were modified by assimilation of the conventional surface land and radiosonde meteorological data, using the 3D-Var component
of the Grid point Statistical Interpolation (GSI) tool [5]. For chemistry, the initial
conditions came from chemistry cycling from a previous day forecast.
43.2.3 Evaluation of the Model Results
Two sets of PM2.5 and PM10 forecasts were compared with the hourly measurements
gathered at a measuring network operated by CIEP in Poland. For PM2.5, measurements from 43 stations were available. For PM10, information from 116 sites were
used for forecasts evaluation. Three error statistics were calculated to summarize the
model performance: mean error (ME), index of agreement (IOA) and factor of two
(FAC2).
43.3 Results
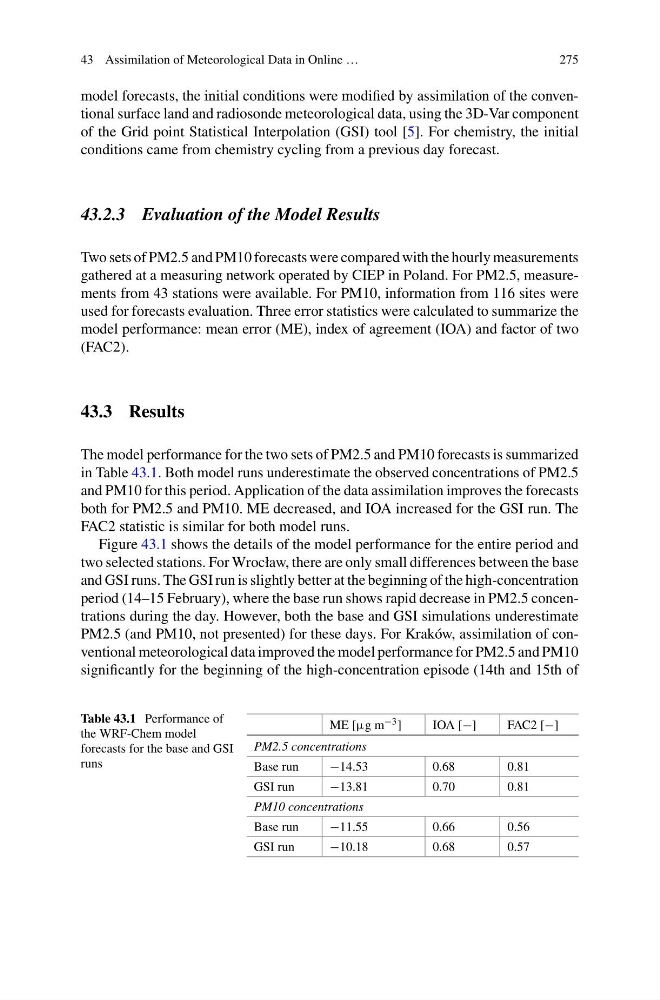
The model performance for the two sets of PM2.5 and PM10 forecasts is summarized
in Table 43.1. Both model runs underestimate the observed concentrations of PM2.5
and PM10 for this period. Application of the data assimilation improves the forecasts
both for PM2.5 and PM10. ME decreased, and IOA increased for the GSI run. The
FAC2 statistic is similar for both model runs.
Figure 43.1 shows the details of the model performance for the entire period and
two selected stations. For Wrocław, there are only small differences between the base
and GSI runs. The GSI run is slightly better at the beginning of the high-concentration
period (14–15 February), where the base run shows rapid decrease in PM2.5 concentrations during the day. However, both the base and GSI simulations underestimate
PM2.5 (and PM10, not presented) for these days. For Kraków, assimilation of conventional meteorological data improved the model performance for PM2.5 and PM10
significantly for the beginning of the high-concentration episode (14th and 15th of
Table 43.1 Performance of
the WRF-Chem model
forecasts for the base and GSI
runs
ME [µg m −3 ]
IOA [−]
FAC2 [−]
PM2.5 concentrations
Base run
−14.53
0.68
0.81
GSI run
−13.81
0.70
0.81
PM10 concentrations
Base run
−11.55
0.66
0.56
GSI run
−10.18
0.68
0.57
275
model forecasts, the initial conditions were modified by assimilation of the conventional surface land and radiosonde meteorological data, using the 3D-Var component
of the Grid point Statistical Interpolation (GSI) tool [5]. For chemistry, the initial
conditions came from chemistry cycling from a previous day forecast.
43.2.3 Evaluation of the Model Results
Two sets of PM2.5 and PM10 forecasts were compared with the hourly measurements
gathered at a measuring network operated by CIEP in Poland. For PM2.5, measurements from 43 stations were available. For PM10, information from 116 sites were
used for forecasts evaluation. Three error statistics were calculated to summarize the
model performance: mean error (ME), index of agreement (IOA) and factor of two
(FAC2).
43.3 Results
The model performance for the two sets of PM2.5 and PM10 forecasts is summarized
in Table 43.1. Both model runs underestimate the observed concentrations of PM2.5
and PM10 for this period. Application of the data assimilation improves the forecasts
both for PM2.5 and PM10. ME decreased, and IOA increased for the GSI run. The
FAC2 statistic is similar for both model runs.
Figure 43.1 shows the details of the model performance for the entire period and
two selected stations. For Wrocław, there are only small differences between the base
and GSI runs. The GSI run is slightly better at the beginning of the high-concentration
period (14–15 February), where the base run shows rapid decrease in PM2.5 concentrations during the day. However, both the base and GSI simulations underestimate
PM2.5 (and PM10, not presented) for these days. For Kraków, assimilation of conventional meteorological data improved the model performance for PM2.5 and PM10
significantly for the beginning of the high-concentration episode (14th and 15th of
Table 43.1 Performance of
the WRF-Chem model
forecasts for the base and GSI
runs
ME [µg m −3 ]
IOA [−]
FAC2 [−]
PM2.5 concentrations
Base run
−14.53
0.68
0.81
GSI run
−13.81
0.70
0.81
PM10 concentrations
Base run
−11.55
0.66
0.56
GSI run
−10.18
0.68
0.57