

41 Importance of Inventory Representativeness …
263
41.2 Description of Updated Emissions
By 2017 a 2013 Canadian APEI and a 2008 Mexican inventory for AQ modelling had
become available as well as the first version of the 2014 U.S. NEI [1, 4]. In addition,
the U.S. EPA had also developed several versions of a projected 2017 NEI for its
2011 Air Emissions Modeling Platform for policy development applications [5].
Given the continuing decline in Canadian and U.S. air pollutant emissions shown
in Fig. 41.1, there was a strong argument for AQ forecasting in 2017 to move to
inventories whose base years were more recent than 2010, 2011, and 1999. As well,
the significant decrease in U.S. SO 2 and NO x emissions that had occurred even
between 2014 and 2016 suggested that an inventory for base year 2017 might be
more appropriate for forecasting in 2017 and beyond than one for base year 2014,
even though the former was a projected inventory whereas the latter was an actual
inventory. One additional consideration was that a second version of the 2014 U.S,
NEI was expected to be released at the end of 2017, so that the available version of
the 2014 U.S. NEI was only a preliminary version.
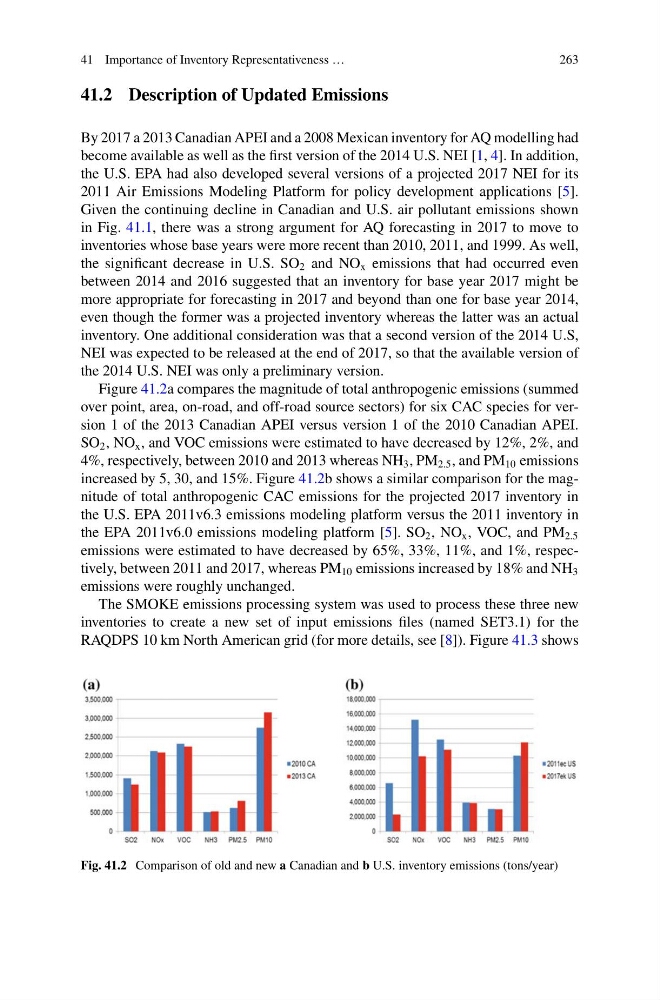
Figure 41.2a compares the magnitude of total anthropogenic emissions (summed
over point, area, on-road, and off-road source sectors) for six CAC species for version 1 of the 2013 Canadian APEI versus version 1 of the 2010 Canadian APEI.
SO 2 , NO x , and VOC emissions were estimated to have decreased by 12%, 2%, and
4%, respectively, between 2010 and 2013 whereas NH 3 , PM 2.5 , and PM 10 emissions
increased by 5, 30, and 15%. Figure 41.2b shows a similar comparison for the magnitude of total anthropogenic CAC emissions for the projected 2017 inventory in
the U.S. EPA 2011v6.3 emissions modeling platform versus the 2011 inventory in
the EPA 2011v6.0 emissions modeling platform [5]. SO 2 , NO x , VOC, and PM 2.5
emissions were estimated to have decreased by 65%, 33%, 11%, and 1%, respectively, between 2011 and 2017, whereas PM 10 emissions increased by 18% and NH 3
emissions were roughly unchanged.
The SMOKE emissions processing system was used to process these three new
inventories to create a new set of input emissions files (named SET3.1) for the
RAQDPS 10 km North American grid (for more details, see [8]). Figure 41.3 shows
Fig. 41.2 Comparison of old and new a Canadian and b U.S. inventory emissions (tons/year)
263
41.2 Description of Updated Emissions
By 2017 a 2013 Canadian APEI and a 2008 Mexican inventory for AQ modelling had
become available as well as the first version of the 2014 U.S. NEI [1, 4]. In addition,
the U.S. EPA had also developed several versions of a projected 2017 NEI for its
2011 Air Emissions Modeling Platform for policy development applications [5].
Given the continuing decline in Canadian and U.S. air pollutant emissions shown
in Fig. 41.1, there was a strong argument for AQ forecasting in 2017 to move to
inventories whose base years were more recent than 2010, 2011, and 1999. As well,
the significant decrease in U.S. SO 2 and NO x emissions that had occurred even
between 2014 and 2016 suggested that an inventory for base year 2017 might be
more appropriate for forecasting in 2017 and beyond than one for base year 2014,
even though the former was a projected inventory whereas the latter was an actual
inventory. One additional consideration was that a second version of the 2014 U.S,
NEI was expected to be released at the end of 2017, so that the available version of
the 2014 U.S. NEI was only a preliminary version.
Figure 41.2a compares the magnitude of total anthropogenic emissions (summed
over point, area, on-road, and off-road source sectors) for six CAC species for version 1 of the 2013 Canadian APEI versus version 1 of the 2010 Canadian APEI.
SO 2 , NO x , and VOC emissions were estimated to have decreased by 12%, 2%, and
4%, respectively, between 2010 and 2013 whereas NH 3 , PM 2.5 , and PM 10 emissions
increased by 5, 30, and 15%. Figure 41.2b shows a similar comparison for the magnitude of total anthropogenic CAC emissions for the projected 2017 inventory in
the U.S. EPA 2011v6.3 emissions modeling platform versus the 2011 inventory in
the EPA 2011v6.0 emissions modeling platform [5]. SO 2 , NO x , VOC, and PM 2.5
emissions were estimated to have decreased by 65%, 33%, 11%, and 1%, respectively, between 2011 and 2017, whereas PM 10 emissions increased by 18% and NH 3
emissions were roughly unchanged.
The SMOKE emissions processing system was used to process these three new
inventories to create a new set of input emissions files (named SET3.1) for the
RAQDPS 10 km North American grid (for more details, see [8]). Figure 41.3 shows
Fig. 41.2 Comparison of old and new a Canadian and b U.S. inventory emissions (tons/year)