

262
M. D. Moran et al.
41.1 Introduction
Although current air quality is determined by current pollutant emissions, operational
AQ forecasts are usually performed based on retrospective emissions inventories,
that is, on inventories that are representative of a past base year. When emissions
levels are changing rapidly, however, retrospective inventories may not accurately
represent current emission levels, as is now the case in North America due to the
continuing decrease of emissions of many criteria air contaminants (CACs) in both
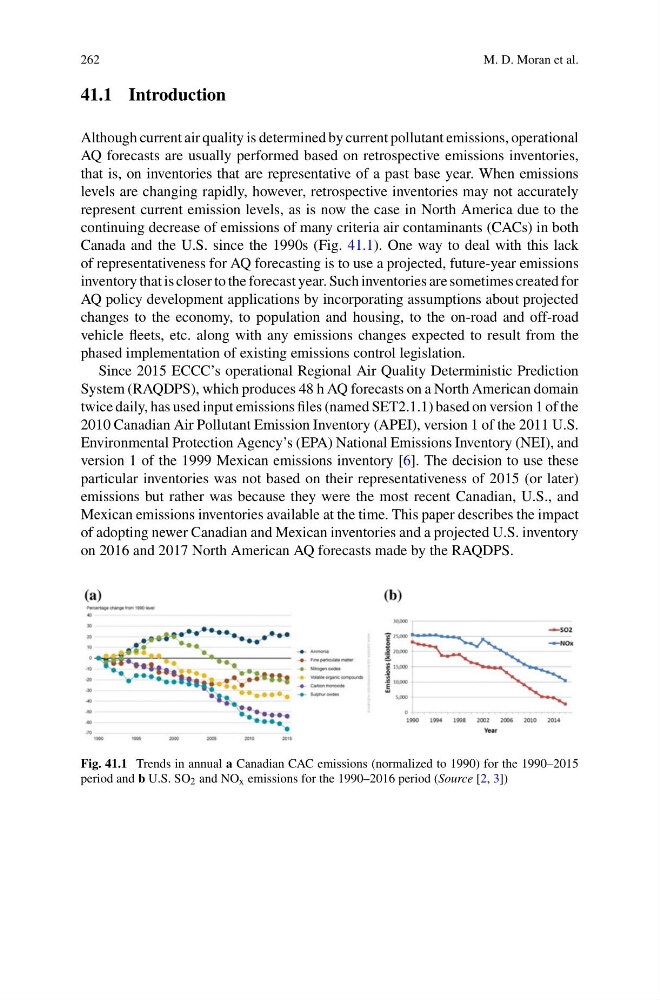
Canada and the U.S. since the 1990s (Fig. 41.1). One way to deal with this lack
of representativeness for AQ forecasting is to use a projected, future-year emissions
inventory that is closer to the forecast year. Such inventories are sometimes created for
AQ policy development applications by incorporating assumptions about projected
changes to the economy, to population and housing, to the on-road and off-road
vehicle fleets, etc. along with any emissions changes expected to result from the
phased implementation of existing emissions control legislation.
Since 2015 ECCC’s operational Regional Air Quality Deterministic Prediction
System (RAQDPS), which produces 48 h AQ forecasts on a North American domain
twice daily, has used input emissions files (named SET2.1.1) based on version 1 of the
2010 Canadian Air Pollutant Emission Inventory (APEI), version 1 of the 2011 U.S.
Environmental Protection Agency’s (EPA) National Emissions Inventory (NEI), and
version 1 of the 1999 Mexican emissions inventory [6]. The decision to use these
particular inventories was not based on their representativeness of 2015 (or later)
emissions but rather was because they were the most recent Canadian, U.S., and
Mexican emissions inventories available at the time. This paper describes the impact
of adopting newer Canadian and Mexican inventories and a projected U.S. inventory
on 2016 and 2017 North American AQ forecasts made by the RAQDPS.
Fig. 41.1 Trends in annual a Canadian CAC emissions (normalized to 1990) for the 1990–2015
period and b U.S. SO 2 and NO x emissions for the 1990–2016 period (Source [2, 3])
M. D. Moran et al.
41.1 Introduction
Although current air quality is determined by current pollutant emissions, operational
AQ forecasts are usually performed based on retrospective emissions inventories,
that is, on inventories that are representative of a past base year. When emissions
levels are changing rapidly, however, retrospective inventories may not accurately
represent current emission levels, as is now the case in North America due to the
continuing decrease of emissions of many criteria air contaminants (CACs) in both
Canada and the U.S. since the 1990s (Fig. 41.1). One way to deal with this lack
of representativeness for AQ forecasting is to use a projected, future-year emissions
inventory that is closer to the forecast year. Such inventories are sometimes created for
AQ policy development applications by incorporating assumptions about projected
changes to the economy, to population and housing, to the on-road and off-road
vehicle fleets, etc. along with any emissions changes expected to result from the
phased implementation of existing emissions control legislation.
Since 2015 ECCC’s operational Regional Air Quality Deterministic Prediction
System (RAQDPS), which produces 48 h AQ forecasts on a North American domain
twice daily, has used input emissions files (named SET2.1.1) based on version 1 of the
2010 Canadian Air Pollutant Emission Inventory (APEI), version 1 of the 2011 U.S.
Environmental Protection Agency’s (EPA) National Emissions Inventory (NEI), and
version 1 of the 1999 Mexican emissions inventory [6]. The decision to use these
particular inventories was not based on their representativeness of 2015 (or later)
emissions but rather was because they were the most recent Canadian, U.S., and
Mexican emissions inventories available at the time. This paper describes the impact
of adopting newer Canadian and Mexican inventories and a projected U.S. inventory
on 2016 and 2017 North American AQ forecasts made by the RAQDPS.
Fig. 41.1 Trends in annual a Canadian CAC emissions (normalized to 1990) for the 1990–2015
period and b U.S. SO 2 and NO x emissions for the 1990–2016 period (Source [2, 3])