

264
M. D. Moran et al.
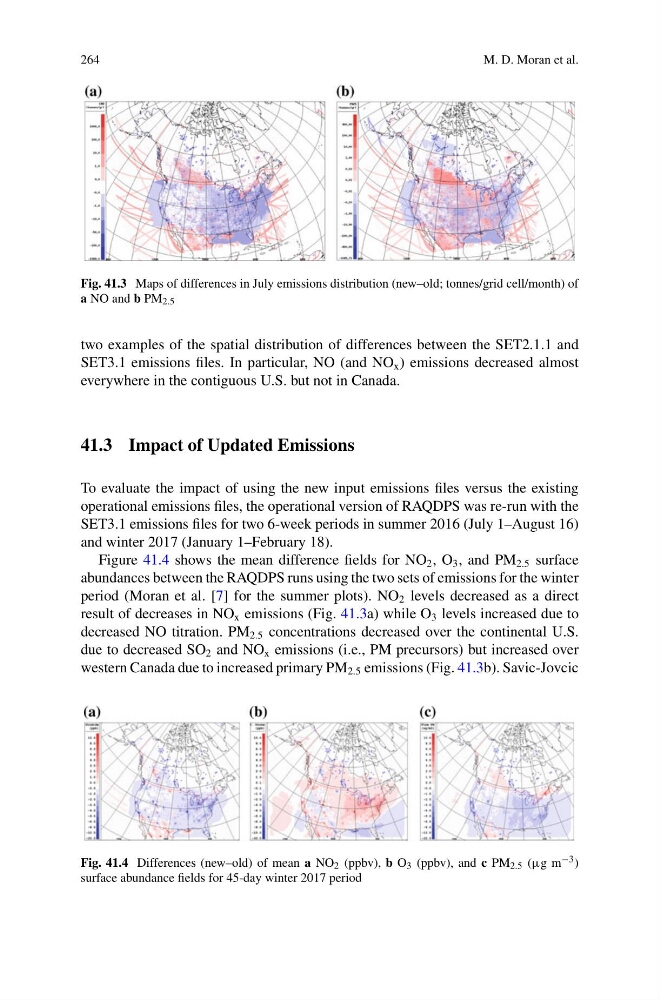
Fig. 41.3 Maps of differences in July emissions distribution (new–old; tonnes/grid cell/month) of
a NO and b PM 2.5
two examples of the spatial distribution of differences between the SET2.1.1 and
SET3.1 emissions files. In particular, NO (and NO x ) emissions decreased almost
everywhere in the contiguous U.S. but not in Canada.
41.3 Impact of Updated Emissions
To evaluate the impact of using the new input emissions files versus the existing
operational emissions files, the operational version of RAQDPS was re-run with the
SET3.1 emissions files for two 6-week periods in summer 2016 (July 1–August 16)
and winter 2017 (January 1–February 18).
Figure 41.4 shows the mean difference fields for NO 2 , O 3 , and PM 2.5 surface
abundances between the RAQDPS runs using the two sets of emissions for the winter
period (Moran et al. [7] for the summer plots). NO 2 levels decreased as a direct
result of decreases in NO x emissions (Fig. 41.3a) while O 3 levels increased due to
decreased NO titration. PM 2.5 concentrations decreased over the continental U.S.
due to decreased SO 2 and NO x emissions (i.e., PM precursors) but increased over
western Canada due to increased primary PM 2.5 emissions (Fig. 41.3b). Savic-Jovcic
Fig. 41.4 Differences (new–old) of mean a NO 2 (ppbv), b O 3 (ppbv), and c PM 2.5 (µg m −3 )
surface abundance fields for 45-day winter 2017 period
M. D. Moran et al.
Fig. 41.3 Maps of differences in July emissions distribution (new–old; tonnes/grid cell/month) of
a NO and b PM 2.5
two examples of the spatial distribution of differences between the SET2.1.1 and
SET3.1 emissions files. In particular, NO (and NO x ) emissions decreased almost
everywhere in the contiguous U.S. but not in Canada.
41.3 Impact of Updated Emissions
To evaluate the impact of using the new input emissions files versus the existing
operational emissions files, the operational version of RAQDPS was re-run with the
SET3.1 emissions files for two 6-week periods in summer 2016 (July 1–August 16)
and winter 2017 (January 1–February 18).
Figure 41.4 shows the mean difference fields for NO 2 , O 3 , and PM 2.5 surface
abundances between the RAQDPS runs using the two sets of emissions for the winter
period (Moran et al. [7] for the summer plots). NO 2 levels decreased as a direct
result of decreases in NO x emissions (Fig. 41.3a) while O 3 levels increased due to
decreased NO titration. PM 2.5 concentrations decreased over the continental U.S.
due to decreased SO 2 and NO x emissions (i.e., PM precursors) but increased over
western Canada due to increased primary PM 2.5 emissions (Fig. 41.3b). Savic-Jovcic
Fig. 41.4 Differences (new–old) of mean a NO 2 (ppbv), b O 3 (ppbv), and c PM 2.5 (µg m −3 )
surface abundance fields for 45-day winter 2017 period