

180
M. O. P. Ramacher et al.
The chemical transport module of TAPM was applied for the Hamburg metropolitan area with a setup of 56 × 56 grid cells of 500 × 500 m
2 each. The chemistry in
TAPM is based on the Generic Reaction Set (GRS) by [2]. To account for initial and
boundary conditions of chemical compounds, TAPM was set-up as part of a oneway nested model chain, which coupled the model off-line to the CMAQv5.0.1 CTM
(Byun und Schere [4] driven by COSMO-CLM mesoscale meteorological model version 5.0 [15] for the year 2012 using the ERA-Interim re-analysis as forcing data [8].
Thus, hourly concentrations are used at the boundaries to account for background
concentrations in the CTM domain.
28.4 PM 2.5 Concentrations and Source Apportionment
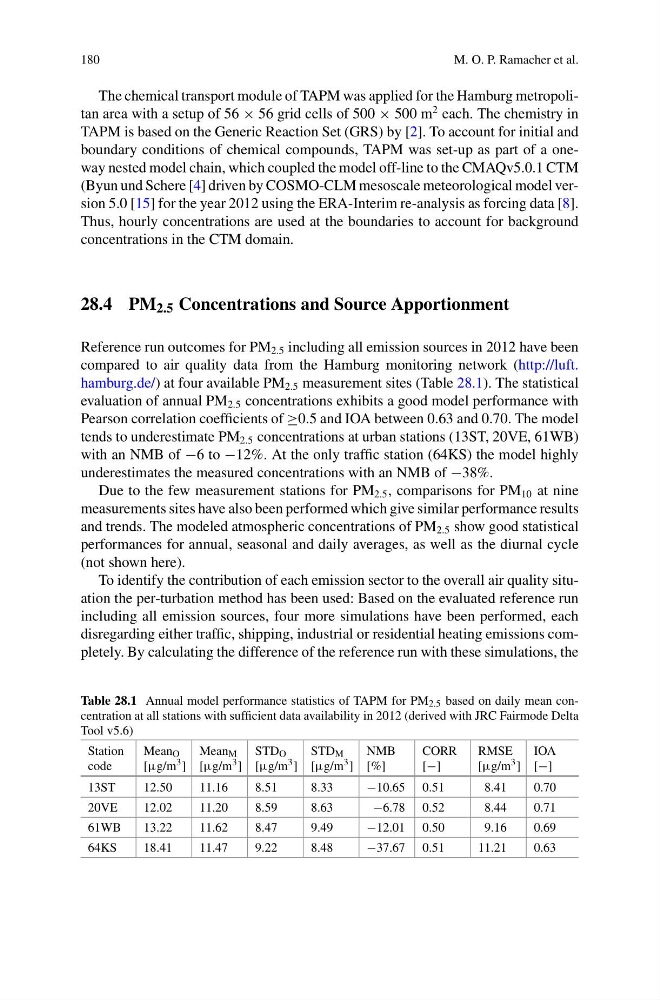
Reference run outcomes for PM 2.5 including all emission sources in 2012 have been
compared to air quality data from the Hamburg monitoring network (http://luft.
hamburg.de/) at four available PM 2.5 measurement sites (Table 28.1). The statistical
evaluation of annual PM 2.5 concentrations exhibits a good model performance with
Pearson correlation coefficients of ≥0.5 and IOA between 0.63 and 0.70. The model
tends to underestimate PM 2.5 concentrations at urban stations (13ST, 20VE, 61WB)
with an NMB of −6 to −12%. At the only traffic station (64KS) the model highly
underestimates the measured concentrations with an NMB of −38%.
Due to the few measurement stations for PM 2.5 , comparisons for PM 10 at nine
measurements sites have also been performed which give similar performance results
and trends. The modeled atmospheric concentrations of PM 2.5 show good statistical
performances for annual, seasonal and daily averages, as well as the diurnal cycle
(not shown here).
To identify the contribution of each emission sector to the overall air quality situation the per-turbation method has been used: Based on the evaluated reference run
including all emission sources, four more simulations have been performed, each
disregarding either traffic, shipping, industrial or residential heating emissions completely. By calculating the difference of the reference run with these simulations, the
Table 28.1 Annual model performance statistics of TAPM for PM 2.5 based on daily mean concentration at all stations with sufficient data availability in 2012 (derived with JRC Fairmode Delta
Tool v5.6)
Station
code
Mean O
[µg/m 3 ]
Mean M
[µg/m 3 ]
STD O
[µg/m 3 ]
STD M
[µg/m 3 ]
NMB
[%]
CORR
[−]
RMSE
[µg/m 3 ]
IOA
[−]
13ST
12.50
11.16
8.51
8.33
−10.65 0.51
8.41
0.70
20VE
12.02
11.20
8.59
8.63
−6.78 0.52
8.44
0.71
61WB
13.22
11.62
8.47
9.49
−12.01 0.50
9.16
0.69
64KS
18.41
11.47
9.22
8.48
−37.67 0.51
11.21
0.63
M. O. P. Ramacher et al.
The chemical transport module of TAPM was applied for the Hamburg metropolitan area with a setup of 56 × 56 grid cells of 500 × 500 m
2 each. The chemistry in
TAPM is based on the Generic Reaction Set (GRS) by [2]. To account for initial and
boundary conditions of chemical compounds, TAPM was set-up as part of a oneway nested model chain, which coupled the model off-line to the CMAQv5.0.1 CTM
(Byun und Schere [4] driven by COSMO-CLM mesoscale meteorological model version 5.0 [15] for the year 2012 using the ERA-Interim re-analysis as forcing data [8].
Thus, hourly concentrations are used at the boundaries to account for background
concentrations in the CTM domain.
28.4 PM 2.5 Concentrations and Source Apportionment
Reference run outcomes for PM 2.5 including all emission sources in 2012 have been
compared to air quality data from the Hamburg monitoring network (http://luft.
hamburg.de/) at four available PM 2.5 measurement sites (Table 28.1). The statistical
evaluation of annual PM 2.5 concentrations exhibits a good model performance with
Pearson correlation coefficients of ≥0.5 and IOA between 0.63 and 0.70. The model
tends to underestimate PM 2.5 concentrations at urban stations (13ST, 20VE, 61WB)
with an NMB of −6 to −12%. At the only traffic station (64KS) the model highly
underestimates the measured concentrations with an NMB of −38%.
Due to the few measurement stations for PM 2.5 , comparisons for PM 10 at nine
measurements sites have also been performed which give similar performance results
and trends. The modeled atmospheric concentrations of PM 2.5 show good statistical
performances for annual, seasonal and daily averages, as well as the diurnal cycle
(not shown here).
To identify the contribution of each emission sector to the overall air quality situation the per-turbation method has been used: Based on the evaluated reference run
including all emission sources, four more simulations have been performed, each
disregarding either traffic, shipping, industrial or residential heating emissions completely. By calculating the difference of the reference run with these simulations, the
Table 28.1 Annual model performance statistics of TAPM for PM 2.5 based on daily mean concentration at all stations with sufficient data availability in 2012 (derived with JRC Fairmode Delta
Tool v5.6)
Station
code
Mean O
[µg/m 3 ]
Mean M
[µg/m 3 ]
STD O
[µg/m 3 ]
STD M
[µg/m 3 ]
NMB
[%]
CORR
[−]
RMSE
[µg/m 3 ]
IOA
[−]
13ST
12.50
11.16
8.51
8.33
−10.65 0.51
8.41
0.70
20VE
12.02
11.20
8.59
8.63
−6.78 0.52
8.44
0.71
61WB
13.22
11.62
8.47
9.49
−12.01 0.50
9.16
0.69
64KS
18.41
11.47
9.22
8.48
−37.67 0.51
11.21
0.63