

25 The Impact of Port Operations on Air Quality in Piraeus …
161
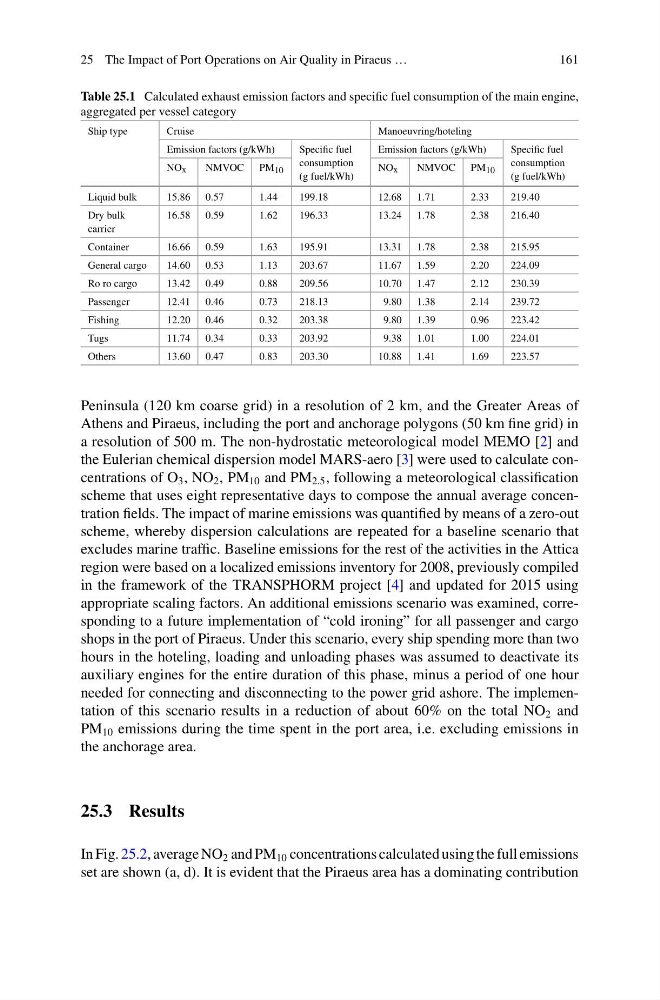
Table 25.1 Calculated exhaust emission factors and specific fuel consumption of the main engine,
aggregated per vessel category
Ship type
Cruise
Manoeuvring/hoteling
Emission factors (g/kWh)
Specific fuel
consumption
(g fuel/kWh)
Emission factors (g/kWh)
Specific fuel
consumption
(g fuel/kWh)
NO x
NMVOC PM 10
NO x
NMVOC PM 10
Liquid bulk
15.86 0.57
1.44
199.18
12.68 1.71
2.33
219.40
Dry bulk
carrier
16.58 0.59
1.62
196.33
13.24 1.78
2.38
216.40
Container
16.66 0.59
1.63
195.91
13.31 1.78
2.38
215.95
General cargo
14.60 0.53
1.13
203.67
11.67 1.59
2.20
224.09
Ro ro cargo
13.42 0.49
0.88
209.56
10.70 1.47
2.12
230.39
Passenger
12.41 0.46
0.73
218.13
9.80 1.38
2.14
239.72
Fishing
12.20 0.46
0.32
203.38
9.80 1.39
0.96
223.42
Tugs
11.74 0.34
0.33
203.92
9.38 1.01
1.00
224.01
Others
13.60 0.47
0.83
203.30
10.88 1.41
1.69
223.57
Peninsula (120 km coarse grid) in a resolution of 2 km, and the Greater Areas of
Athens and Piraeus, including the port and anchorage polygons (50 km fine grid) in
a resolution of 500 m. The non-hydrostatic meteorological model MEMO [2] and
the Eulerian chemical dispersion model MARS-aero [3] were used to calculate concentrations of O 3 , NO 2 , PM 10 and PM 2.5 , following a meteorological classification
scheme that uses eight representative days to compose the annual average concentration fields. The impact of marine emissions was quantified by means of a zero-out
scheme, whereby dispersion calculations are repeated for a baseline scenario that
excludes marine traffic. Baseline emissions for the rest of the activities in the Attica
region were based on a localized emissions inventory for 2008, previously compiled
in the framework of the TRANSPHORM project [4] and updated for 2015 using
appropriate scaling factors. An additional emissions scenario was examined, corresponding to a future implementation of “cold ironing” for all passenger and cargo
shops in the port of Piraeus. Under this scenario, every ship spending more than two
hours in the hoteling, loading and unloading phases was assumed to deactivate its
auxiliary engines for the entire duration of this phase, minus a period of one hour
needed for connecting and disconnecting to the power grid ashore. The implementation of this scenario results in a reduction of about 60% on the total NO 2 and
PM 10 emissions during the time spent in the port area, i.e. excluding emissions in
the anchorage area.
25.3 Results
In Fig. 25.2, average NO 2 and PM 10 concentrations calculated using the full emissions
set are shown (a, d). It is evident that the Piraeus area has a dominating contribution
161
Table 25.1 Calculated exhaust emission factors and specific fuel consumption of the main engine,
aggregated per vessel category
Ship type
Cruise
Manoeuvring/hoteling
Emission factors (g/kWh)
Specific fuel
consumption
(g fuel/kWh)
Emission factors (g/kWh)
Specific fuel
consumption
(g fuel/kWh)
NO x
NMVOC PM 10
NO x
NMVOC PM 10
Liquid bulk
15.86 0.57
1.44
199.18
12.68 1.71
2.33
219.40
Dry bulk
carrier
16.58 0.59
1.62
196.33
13.24 1.78
2.38
216.40
Container
16.66 0.59
1.63
195.91
13.31 1.78
2.38
215.95
General cargo
14.60 0.53
1.13
203.67
11.67 1.59
2.20
224.09
Ro ro cargo
13.42 0.49
0.88
209.56
10.70 1.47
2.12
230.39
Passenger
12.41 0.46
0.73
218.13
9.80 1.38
2.14
239.72
Fishing
12.20 0.46
0.32
203.38
9.80 1.39
0.96
223.42
Tugs
11.74 0.34
0.33
203.92
9.38 1.01
1.00
224.01
Others
13.60 0.47
0.83
203.30
10.88 1.41
1.69
223.57
Peninsula (120 km coarse grid) in a resolution of 2 km, and the Greater Areas of
Athens and Piraeus, including the port and anchorage polygons (50 km fine grid) in
a resolution of 500 m. The non-hydrostatic meteorological model MEMO [2] and
the Eulerian chemical dispersion model MARS-aero [3] were used to calculate concentrations of O 3 , NO 2 , PM 10 and PM 2.5 , following a meteorological classification
scheme that uses eight representative days to compose the annual average concentration fields. The impact of marine emissions was quantified by means of a zero-out
scheme, whereby dispersion calculations are repeated for a baseline scenario that
excludes marine traffic. Baseline emissions for the rest of the activities in the Attica
region were based on a localized emissions inventory for 2008, previously compiled
in the framework of the TRANSPHORM project [4] and updated for 2015 using
appropriate scaling factors. An additional emissions scenario was examined, corresponding to a future implementation of “cold ironing” for all passenger and cargo
shops in the port of Piraeus. Under this scenario, every ship spending more than two
hours in the hoteling, loading and unloading phases was assumed to deactivate its
auxiliary engines for the entire duration of this phase, minus a period of one hour
needed for connecting and disconnecting to the power grid ashore. The implementation of this scenario results in a reduction of about 60% on the total NO 2 and
PM 10 emissions during the time spent in the port area, i.e. excluding emissions in
the anchorage area.
25.3 Results
In Fig. 25.2, average NO 2 and PM 10 concentrations calculated using the full emissions
set are shown (a, d). It is evident that the Piraeus area has a dominating contribution