

162
N. Moussiopoulos et al.
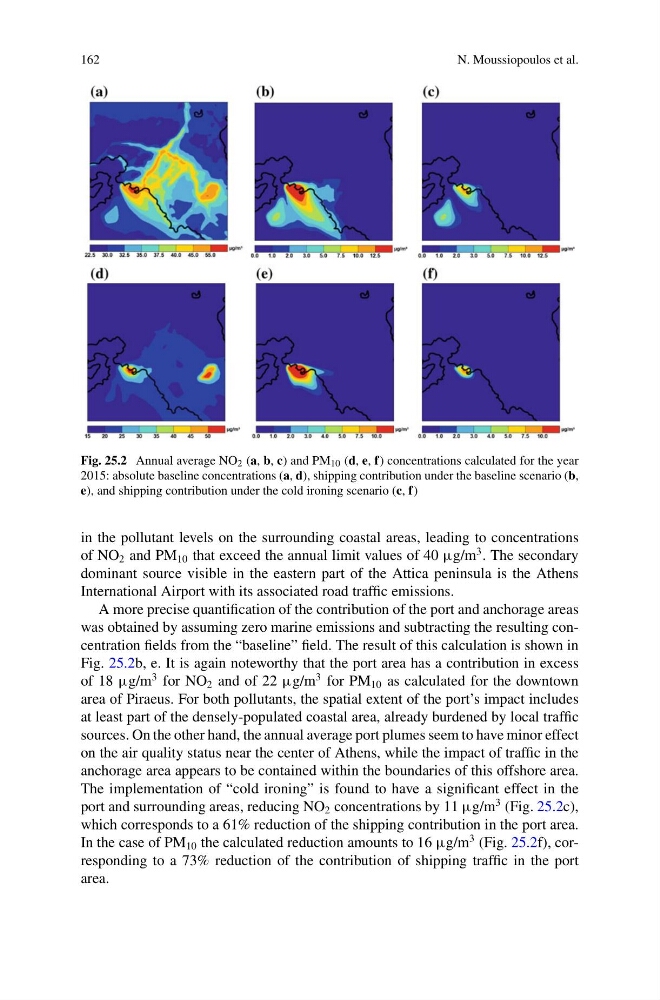
Fig. 25.2 Annual average NO 2 (a, b, c) and PM 10 (d, e, f) concentrations calculated for the year
2015: absolute baseline concentrations (a, d), shipping contribution under the baseline scenario (b,
e), and shipping contribution under the cold ironing scenario (c, f)
in the pollutant levels on the surrounding coastal areas, leading to concentrations
of NO 2 and PM 10 that exceed the annual limit values of 40 µg/m
3 . The secondary
dominant source visible in the eastern part of the Attica peninsula is the Athens
International Airport with its associated road traffic emissions.
A more precise quantification of the contribution of the port and anchorage areas
was obtained by assuming zero marine emissions and subtracting the resulting concentration fields from the “baseline” field. The result of this calculation is shown in
Fig. 25.2b, e. It is again noteworthy that the port area has a contribution in excess
of 18 µg/m
3 for NO 2 and of 22 µg/m
3 for PM 10 as calculated for the downtown
area of Piraeus. For both pollutants, the spatial extent of the port’s impact includes
at least part of the densely-populated coastal area, already burdened by local traffic
sources. On the other hand, the annual average port plumes seem to have minor effect
on the air quality status near the center of Athens, while the impact of traffic in the
anchorage area appears to be contained within the boundaries of this offshore area.
The implementation of “cold ironing” is found to have a significant effect in the
port and surrounding areas, reducing NO 2 concentrations by 11 µg/m
3 (Fig. 25.2c),
which corresponds to a 61% reduction of the shipping contribution in the port area.
In the case of PM 10 the calculated reduction amounts to 16 µg/m
3 (Fig. 25.2f), corresponding to a 73% reduction of the contribution of shipping traffic in the port
area.
N. Moussiopoulos et al.
Fig. 25.2 Annual average NO 2 (a, b, c) and PM 10 (d, e, f) concentrations calculated for the year
2015: absolute baseline concentrations (a, d), shipping contribution under the baseline scenario (b,
e), and shipping contribution under the cold ironing scenario (c, f)
in the pollutant levels on the surrounding coastal areas, leading to concentrations
of NO 2 and PM 10 that exceed the annual limit values of 40 µg/m
3 . The secondary
dominant source visible in the eastern part of the Attica peninsula is the Athens
International Airport with its associated road traffic emissions.
A more precise quantification of the contribution of the port and anchorage areas
was obtained by assuming zero marine emissions and subtracting the resulting concentration fields from the “baseline” field. The result of this calculation is shown in
Fig. 25.2b, e. It is again noteworthy that the port area has a contribution in excess
of 18 µg/m
3 for NO 2 and of 22 µg/m
3 for PM 10 as calculated for the downtown
area of Piraeus. For both pollutants, the spatial extent of the port’s impact includes
at least part of the densely-populated coastal area, already burdened by local traffic
sources. On the other hand, the annual average port plumes seem to have minor effect
on the air quality status near the center of Athens, while the impact of traffic in the
anchorage area appears to be contained within the boundaries of this offshore area.
The implementation of “cold ironing” is found to have a significant effect in the
port and surrounding areas, reducing NO 2 concentrations by 11 µg/m
3 (Fig. 25.2c),
which corresponds to a 61% reduction of the shipping contribution in the port area.
In the case of PM 10 the calculated reduction amounts to 16 µg/m
3 (Fig. 25.2f), corresponding to a 73% reduction of the contribution of shipping traffic in the port
area.