

18 Development and Current Status of the GEM-MACH-Global …
111
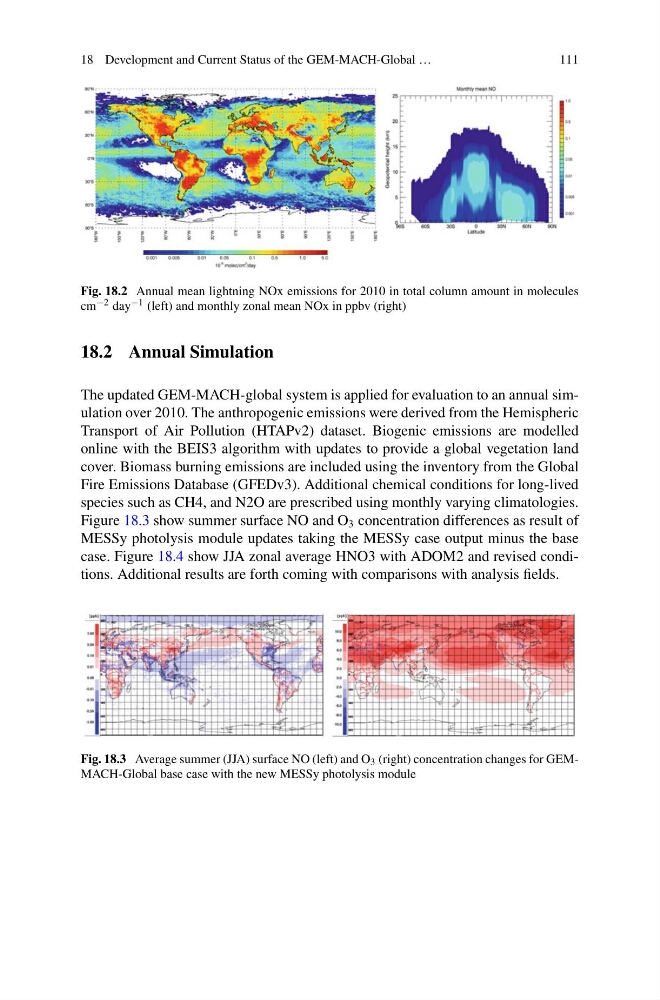
Fig. 18.2 Annual mean lightning NOx emissions for 2010 in total column amount in molecules
cm −2 day −1 (left) and monthly zonal mean NOx in ppbv (right)
18.2 Annual Simulation
The updated GEM-MACH-global system is applied for evaluation to an annual simulation over 2010. The anthropogenic emissions were derived from the Hemispheric
Transport of Air Pollution (HTAPv2) dataset. Biogenic emissions are modelled
online with the BEIS3 algorithm with updates to provide a global vegetation land
cover. Biomass burning emissions are included using the inventory from the Global
Fire Emissions Database (GFEDv3). Additional chemical conditions for long-lived
species such as CH4, and N2O are prescribed using monthly varying climatologies.
Figure 18.3 show summer surface NO and O 3 concentration differences as result of
MESSy photolysis module updates taking the MESSy case output minus the base
case. Figure 18.4 show JJA zonal average HNO3 with ADOM2 and revised conditions. Additional results are forth coming with comparisons with analysis fields.
Fig. 18.3 Average summer (JJA) surface NO (left) and O 3 (right) concentration changes for GEMMACH-Global base case with the new MESSy photolysis module
111
Fig. 18.2 Annual mean lightning NOx emissions for 2010 in total column amount in molecules
cm −2 day −1 (left) and monthly zonal mean NOx in ppbv (right)
18.2 Annual Simulation
The updated GEM-MACH-global system is applied for evaluation to an annual simulation over 2010. The anthropogenic emissions were derived from the Hemispheric
Transport of Air Pollution (HTAPv2) dataset. Biogenic emissions are modelled
online with the BEIS3 algorithm with updates to provide a global vegetation land
cover. Biomass burning emissions are included using the inventory from the Global
Fire Emissions Database (GFEDv3). Additional chemical conditions for long-lived
species such as CH4, and N2O are prescribed using monthly varying climatologies.
Figure 18.3 show summer surface NO and O 3 concentration differences as result of
MESSy photolysis module updates taking the MESSy case output minus the base
case. Figure 18.4 show JJA zonal average HNO3 with ADOM2 and revised conditions. Additional results are forth coming with comparisons with analysis fields.
Fig. 18.3 Average summer (JJA) surface NO (left) and O 3 (right) concentration changes for GEMMACH-Global base case with the new MESSy photolysis module