

110
J. Chen et al.
GEMMACH_MESSy
GEMMACH_BaseCase
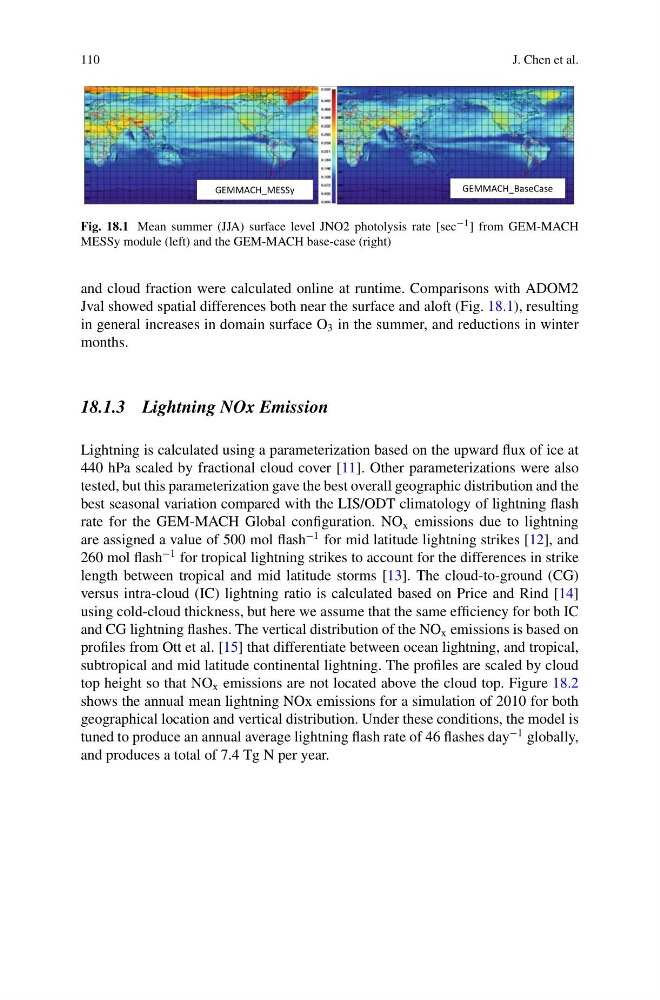
Fig. 18.1 Mean summer (JJA) surface level JNO2 photolysis rate [sec −1 ] from GEM-MACH
MESSy module (left) and the GEM-MACH base-case (right)
and cloud fraction were calculated online at runtime. Comparisons with ADOM2
Jval showed spatial differences both near the surface and aloft (Fig. 18.1), resulting
in general increases in domain surface O 3 in the summer, and reductions in winter
months.
18.1.3 Lightning NOx Emission
Lightning is calculated using a parameterization based on the upward flux of ice at
440 hPa scaled by fractional cloud cover [11]. Other parameterizations were also
tested, but this parameterization gave the best overall geographic distribution and the
best seasonal variation compared with the LIS/ODT climatology of lightning flash
rate for the GEM-MACH Global configuration. NO x emissions due to lightning
are assigned a value of 500 mol flash
−1 for mid latitude lightning strikes [12], and
260 mol flash
−1 for tropical lightning strikes to account for the differences in strike
length between tropical and mid latitude storms [13]. The cloud-to-ground (CG)
versus intra-cloud (IC) lightning ratio is calculated based on Price and Rind [14]
using cold-cloud thickness, but here we assume that the same efficiency for both IC
and CG lightning flashes. The vertical distribution of the NO x emissions is based on
profiles from Ott et al. [15] that differentiate between ocean lightning, and tropical,
subtropical and mid latitude continental lightning. The profiles are scaled by cloud
top height so that NO x emissions are not located above the cloud top. Figure 18.2
shows the annual mean lightning NOx emissions for a simulation of 2010 for both
geographical location and vertical distribution. Under these conditions, the model is
tuned to produce an annual average lightning flash rate of 46 flashes day
−1 globally,
and produces a total of 7.4 Tg N per year.
J. Chen et al.
GEMMACH_MESSy
GEMMACH_BaseCase
Fig. 18.1 Mean summer (JJA) surface level JNO2 photolysis rate [sec −1 ] from GEM-MACH
MESSy module (left) and the GEM-MACH base-case (right)
and cloud fraction were calculated online at runtime. Comparisons with ADOM2
Jval showed spatial differences both near the surface and aloft (Fig. 18.1), resulting
in general increases in domain surface O 3 in the summer, and reductions in winter
months.
18.1.3 Lightning NOx Emission
Lightning is calculated using a parameterization based on the upward flux of ice at
440 hPa scaled by fractional cloud cover [11]. Other parameterizations were also
tested, but this parameterization gave the best overall geographic distribution and the
best seasonal variation compared with the LIS/ODT climatology of lightning flash
rate for the GEM-MACH Global configuration. NO x emissions due to lightning
are assigned a value of 500 mol flash
−1 for mid latitude lightning strikes [12], and
260 mol flash
−1 for tropical lightning strikes to account for the differences in strike
length between tropical and mid latitude storms [13]. The cloud-to-ground (CG)
versus intra-cloud (IC) lightning ratio is calculated based on Price and Rind [14]
using cold-cloud thickness, but here we assume that the same efficiency for both IC
and CG lightning flashes. The vertical distribution of the NO x emissions is based on
profiles from Ott et al. [15] that differentiate between ocean lightning, and tropical,
subtropical and mid latitude continental lightning. The profiles are scaled by cloud
top height so that NO x emissions are not located above the cloud top. Figure 18.2
shows the annual mean lightning NOx emissions for a simulation of 2010 for both
geographical location and vertical distribution. Under these conditions, the model is
tuned to produce an annual average lightning flash rate of 46 flashes day
−1 globally,
and produces a total of 7.4 Tg N per year.