

96
B. Koo et al.
Table 16.1 Normalized mean bias and error (NMB and NME) and correlation coefficient (r)
statistics for 24-h average PM 2.5 NO 3
− , NH 4
+ and Cl − by ISORROPIA (ISO) and EQSAM4clim
(EQS) in January
Network
Species
NMB (%)
NME (%)
r
ISO
EQS
ISO
EQS
ISO
EQS
CSN
NO 3
−
3.1
1.4
51.4
50.0
0.50
0.51
NH 4
+
−7.5
−9.7
40.6
39.4
0.63
0.65
Cl −
79.0
−12.9
169
115
0.14
0.15
IMPROVE
NO 3
−
43.6
34.3
86.9
82.2
0.69
0.70
NH 4
+
7.6
3.7
45.0
43.7
0.82
0.82
Cl −
60.9
−29.3
192
124
0.29
0.28
sites are located in rural areas whereas CSN sites are mostly in urban/suburban areas.
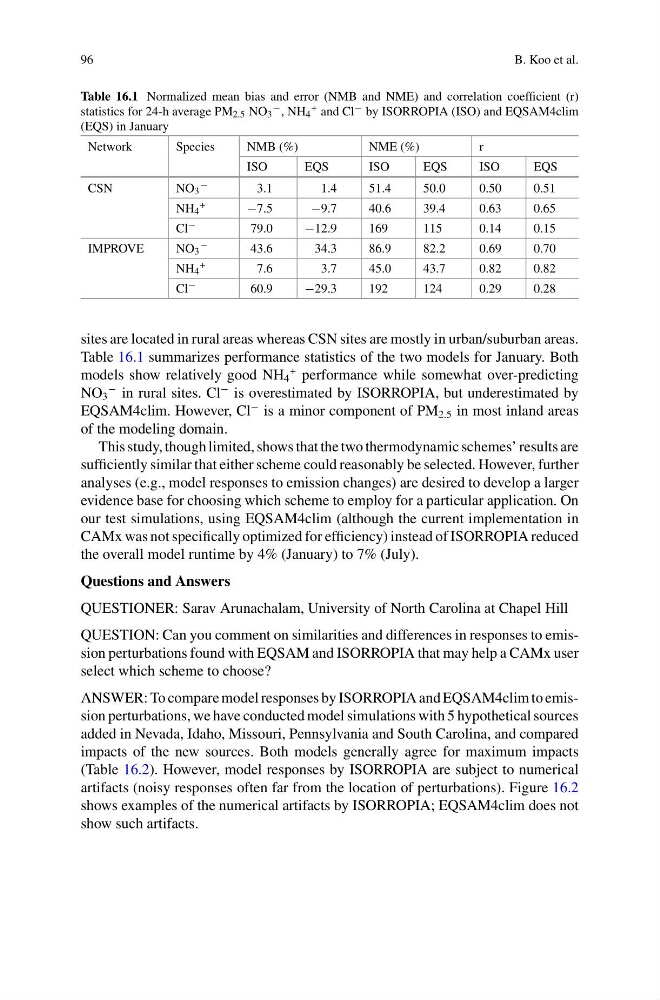
Table 16.1 summarizes performance statistics of the two models for January. Both
models show relatively good NH 4
+ performance while somewhat over-predicting
NO 3
− in rural sites. Cl
− is overestimated by ISORROPIA, but underestimated by
EQSAM4clim. However, Cl
− is a minor component of PM 2.5 in most inland areas
of the modeling domain.
This study, though limited, shows that the two thermodynamic schemes’ results are
sufficiently similar that either scheme could reasonably be selected. However, further
analyses (e.g., model responses to emission changes) are desired to develop a larger
evidence base for choosing which scheme to employ for a particular application. On
our test simulations, using EQSAM4clim (although the current implementation in
CAMx was not specifically optimized for efficiency) instead of ISORROPIA reduced
the overall model runtime by 4% (January) to 7% (July).
Questions and Answers
QUESTIONER: Sarav Arunachalam, University of North Carolina at Chapel Hill
QUESTION: Can you comment on similarities and differences in responses to emission perturbations found with EQSAM and ISORROPIA that may help a CAMx user
select which scheme to choose?
ANSWER: To compare model responses by ISORROPIA and EQSAM4clim to emission perturbations, we have conducted model simulations with 5 hypothetical sources
added in Nevada, Idaho, Missouri, Pennsylvania and South Carolina, and compared
impacts of the new sources. Both models generally agree for maximum impacts
(Table 16.2). However, model responses by ISORROPIA are subject to numerical
artifacts (noisy responses often far from the location of perturbations). Figure 16.2
shows examples of the numerical artifacts by ISORROPIA; EQSAM4clim does not
show such artifacts.
B. Koo et al.
Table 16.1 Normalized mean bias and error (NMB and NME) and correlation coefficient (r)
statistics for 24-h average PM 2.5 NO 3
− , NH 4
+ and Cl − by ISORROPIA (ISO) and EQSAM4clim
(EQS) in January
Network
Species
NMB (%)
NME (%)
r
ISO
EQS
ISO
EQS
ISO
EQS
CSN
NO 3
−
3.1
1.4
51.4
50.0
0.50
0.51
NH 4
+
−7.5
−9.7
40.6
39.4
0.63
0.65
Cl −
79.0
−12.9
169
115
0.14
0.15
IMPROVE
NO 3
−
43.6
34.3
86.9
82.2
0.69
0.70
NH 4
+
7.6
3.7
45.0
43.7
0.82
0.82
Cl −
60.9
−29.3
192
124
0.29
0.28
sites are located in rural areas whereas CSN sites are mostly in urban/suburban areas.
Table 16.1 summarizes performance statistics of the two models for January. Both
models show relatively good NH 4
+ performance while somewhat over-predicting
NO 3
− in rural sites. Cl
− is overestimated by ISORROPIA, but underestimated by
EQSAM4clim. However, Cl
− is a minor component of PM 2.5 in most inland areas
of the modeling domain.
This study, though limited, shows that the two thermodynamic schemes’ results are
sufficiently similar that either scheme could reasonably be selected. However, further
analyses (e.g., model responses to emission changes) are desired to develop a larger
evidence base for choosing which scheme to employ for a particular application. On
our test simulations, using EQSAM4clim (although the current implementation in
CAMx was not specifically optimized for efficiency) instead of ISORROPIA reduced
the overall model runtime by 4% (January) to 7% (July).
Questions and Answers
QUESTIONER: Sarav Arunachalam, University of North Carolina at Chapel Hill
QUESTION: Can you comment on similarities and differences in responses to emission perturbations found with EQSAM and ISORROPIA that may help a CAMx user
select which scheme to choose?
ANSWER: To compare model responses by ISORROPIA and EQSAM4clim to emission perturbations, we have conducted model simulations with 5 hypothetical sources
added in Nevada, Idaho, Missouri, Pennsylvania and South Carolina, and compared
impacts of the new sources. Both models generally agree for maximum impacts
(Table 16.2). However, model responses by ISORROPIA are subject to numerical
artifacts (noisy responses often far from the location of perturbations). Figure 16.2
shows examples of the numerical artifacts by ISORROPIA; EQSAM4clim does not
show such artifacts.