

16 Comparing the ISORROPIA and EQSAM Aerosol …
97
Table 16.2 Maximum 24-h average responses to adding 5 hypothetical sources in January
Source
PM 2.5 NO 3
− (µg/m 3 )
PM 2.5 NH 4
+ (µg/m 3 )
ISORROPIA
EQSAM4clim
ISORROPIA
EQSAM4clim
Nevada
0.05
0.04
0.03
0.03
Idaho
0.02
0.02
0.01
0.01
Missouri
0.04
0.09
0.03
0.03
Pennsylvania
0.05
0.06
0.02
0.02
S. Carolina
0.05
0.05
0.02
0.02
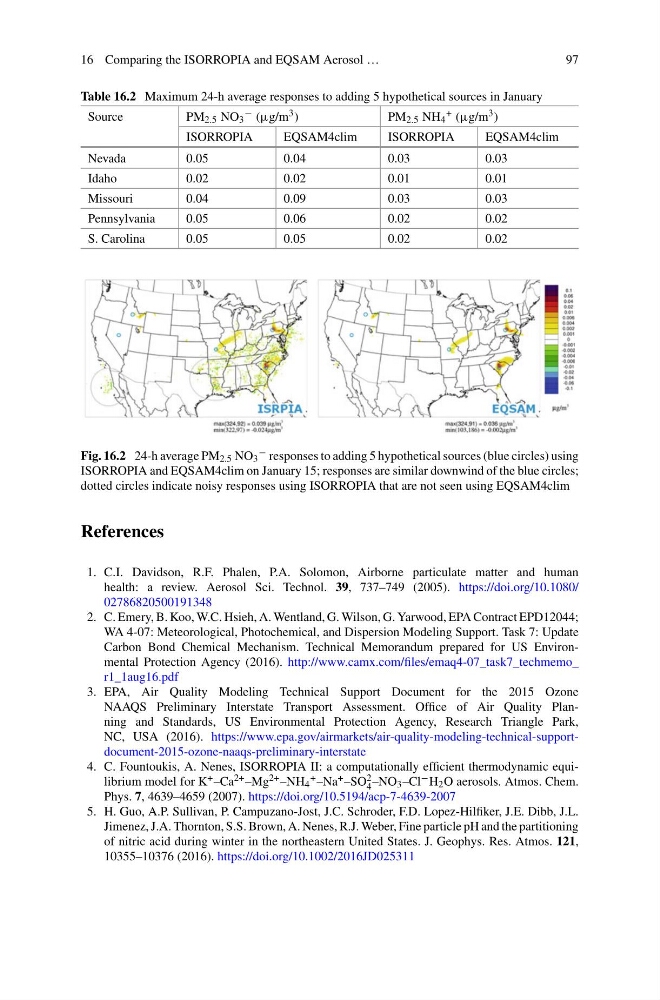
Fig. 16.2 24-h average PM 2.5 NO 3
− responses to adding 5 hypothetical sources (blue circles) using
ISORROPIA and EQSAM4clim on January 15; responses are similar downwind of the blue circles;
dotted circles indicate noisy responses using ISORROPIA that are not seen using EQSAM4clim
References
1. C.I. Davidson, R.F. Phalen, P.A. Solomon, Airborne particulate matter and human
health: a review. Aerosol Sci. Technol. 39, 737–749 (2005). https://doi.org/10.1080/
02786820500191348
2. C. Emery, B. Koo, W.C. Hsieh, A. Wentland, G. Wilson, G. Yarwood, EPA Contract EPD12044;
WA 4-07: Meteorological, Photochemical, and Dispersion Modeling Support. Task 7: Update
Carbon Bond Chemical Mechanism. Technical Memorandum prepared for US Environmental Protection Agency (2016). http://www.camx.com/files/emaq4-07_task7_techmemo_
r1_1aug16.pdf
3. EPA, Air Quality Modeling Technical Support Document for the 2015 Ozone
NAAQS Preliminary Interstate Transport Assessment. Office of Air Quality Planning and Standards, US Environmental Protection Agency, Research Triangle Park,
NC, USA (2016). https://www.epa.gov/airmarkets/air-quality-modeling-technical-supportdocument-2015-ozone-naaqs-preliminary-interstate
4. C. Fountoukis, A. Nenes, ISORROPIA II: a computationally efficient thermodynamic equilibrium model for K + –Ca 2+ –Mg 2+ –NH 4
+ –Na + –SO 2
4 –NO 3 –Cl − H 2 O aerosols. Atmos. Chem.
Phys. 7, 4639–4659 (2007). https://doi.org/10.5194/acp-7-4639-2007
5. H. Guo, A.P. Sullivan, P. Campuzano-Jost, J.C. Schroder, F.D. Lopez-Hilfiker, J.E. Dibb, J.L.
Jimenez, J.A. Thornton, S.S. Brown, A. Nenes, R.J. Weber, Fine particle pH and the partitioning
of nitric acid during winter in the northeastern United States. J. Geophys. Res. Atmos. 121,
10355–10376 (2016). https://doi.org/10.1002/2016JD025311
97
Table 16.2 Maximum 24-h average responses to adding 5 hypothetical sources in January
Source
PM 2.5 NO 3
− (µg/m 3 )
PM 2.5 NH 4
+ (µg/m 3 )
ISORROPIA
EQSAM4clim
ISORROPIA
EQSAM4clim
Nevada
0.05
0.04
0.03
0.03
Idaho
0.02
0.02
0.01
0.01
Missouri
0.04
0.09
0.03
0.03
Pennsylvania
0.05
0.06
0.02
0.02
S. Carolina
0.05
0.05
0.02
0.02
Fig. 16.2 24-h average PM 2.5 NO 3
− responses to adding 5 hypothetical sources (blue circles) using
ISORROPIA and EQSAM4clim on January 15; responses are similar downwind of the blue circles;
dotted circles indicate noisy responses using ISORROPIA that are not seen using EQSAM4clim
References
1. C.I. Davidson, R.F. Phalen, P.A. Solomon, Airborne particulate matter and human
health: a review. Aerosol Sci. Technol. 39, 737–749 (2005). https://doi.org/10.1080/
02786820500191348
2. C. Emery, B. Koo, W.C. Hsieh, A. Wentland, G. Wilson, G. Yarwood, EPA Contract EPD12044;
WA 4-07: Meteorological, Photochemical, and Dispersion Modeling Support. Task 7: Update
Carbon Bond Chemical Mechanism. Technical Memorandum prepared for US Environmental Protection Agency (2016). http://www.camx.com/files/emaq4-07_task7_techmemo_
r1_1aug16.pdf
3. EPA, Air Quality Modeling Technical Support Document for the 2015 Ozone
NAAQS Preliminary Interstate Transport Assessment. Office of Air Quality Planning and Standards, US Environmental Protection Agency, Research Triangle Park,
NC, USA (2016). https://www.epa.gov/airmarkets/air-quality-modeling-technical-supportdocument-2015-ozone-naaqs-preliminary-interstate
4. C. Fountoukis, A. Nenes, ISORROPIA II: a computationally efficient thermodynamic equilibrium model for K + –Ca 2+ –Mg 2+ –NH 4
+ –Na + –SO 2
4 –NO 3 –Cl − H 2 O aerosols. Atmos. Chem.
Phys. 7, 4639–4659 (2007). https://doi.org/10.5194/acp-7-4639-2007
5. H. Guo, A.P. Sullivan, P. Campuzano-Jost, J.C. Schroder, F.D. Lopez-Hilfiker, J.E. Dibb, J.L.
Jimenez, J.A. Thornton, S.S. Brown, A. Nenes, R.J. Weber, Fine particle pH and the partitioning
of nitric acid during winter in the northeastern United States. J. Geophys. Res. Atmos. 121,
10355–10376 (2016). https://doi.org/10.1002/2016JD025311