

Nano-technology for Real-Time Control of the Red Palm …
333
4 Results and Discussion
4.1 Early Detection of the RPW Using Heat, Sound,
and Spectral Sensors (HSSS)
4.1.1 Sound Fingerprint for RPW Detection
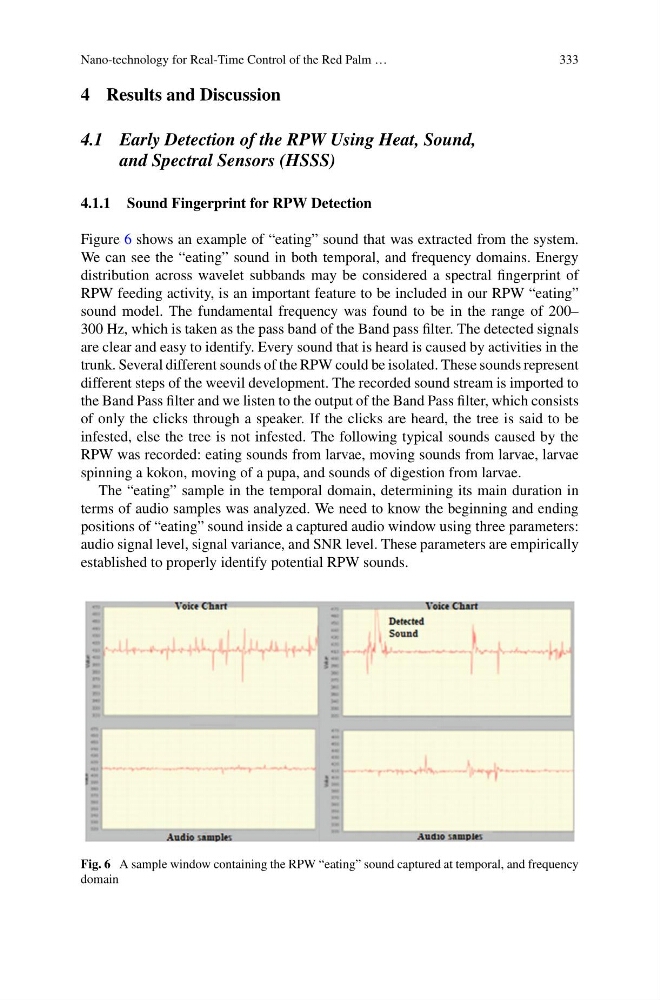
Figure 6 shows an example of “eating” sound that was extracted from the system.
We can see the “eating” sound in both temporal, and frequency domains. Energy
distribution across wavelet subbands may be considered a spectral fingerprint of
RPW feeding activity, is an important feature to be included in our RPW “eating”
sound model. The fundamental frequency was found to be in the range of 200–
300 Hz, which is taken as the pass band of the Band pass filter. The detected signals
are clear and easy to identify. Every sound that is heard is caused by activities in the
trunk. Several different sounds of the RPW could be isolated. These sounds represent
different steps of the weevil development. The recorded sound stream is imported to
the Band Pass filter and we listen to the output of the Band Pass filter, which consists
of only the clicks through a speaker. If the clicks are heard, the tree is said to be
infested, else the tree is not infested. The following typical sounds caused by the
RPW was recorded: eating sounds from larvae, moving sounds from larvae, larvae
spinning a kokon, moving of a pupa, and sounds of digestion from larvae.
The “eating” sample in the temporal domain, determining its main duration in
terms of audio samples was analyzed. We need to know the beginning and ending
positions of “eating” sound inside a captured audio window using three parameters:
audio signal level, signal variance, and SNR level. These parameters are empirically
established to properly identify potential RPW sounds.
Fig. 6 A sample window containing the RPW “eating” sound captured at temporal, and frequency
domain
333
4 Results and Discussion
4.1 Early Detection of the RPW Using Heat, Sound,
and Spectral Sensors (HSSS)
4.1.1 Sound Fingerprint for RPW Detection
Figure 6 shows an example of “eating” sound that was extracted from the system.
We can see the “eating” sound in both temporal, and frequency domains. Energy
distribution across wavelet subbands may be considered a spectral fingerprint of
RPW feeding activity, is an important feature to be included in our RPW “eating”
sound model. The fundamental frequency was found to be in the range of 200–
300 Hz, which is taken as the pass band of the Band pass filter. The detected signals
are clear and easy to identify. Every sound that is heard is caused by activities in the
trunk. Several different sounds of the RPW could be isolated. These sounds represent
different steps of the weevil development. The recorded sound stream is imported to
the Band Pass filter and we listen to the output of the Band Pass filter, which consists
of only the clicks through a speaker. If the clicks are heard, the tree is said to be
infested, else the tree is not infested. The following typical sounds caused by the
RPW was recorded: eating sounds from larvae, moving sounds from larvae, larvae
spinning a kokon, moving of a pupa, and sounds of digestion from larvae.
The “eating” sample in the temporal domain, determining its main duration in
terms of audio samples was analyzed. We need to know the beginning and ending
positions of “eating” sound inside a captured audio window using three parameters:
audio signal level, signal variance, and SNR level. These parameters are empirically
established to properly identify potential RPW sounds.
Fig. 6 A sample window containing the RPW “eating” sound captured at temporal, and frequency
domain