

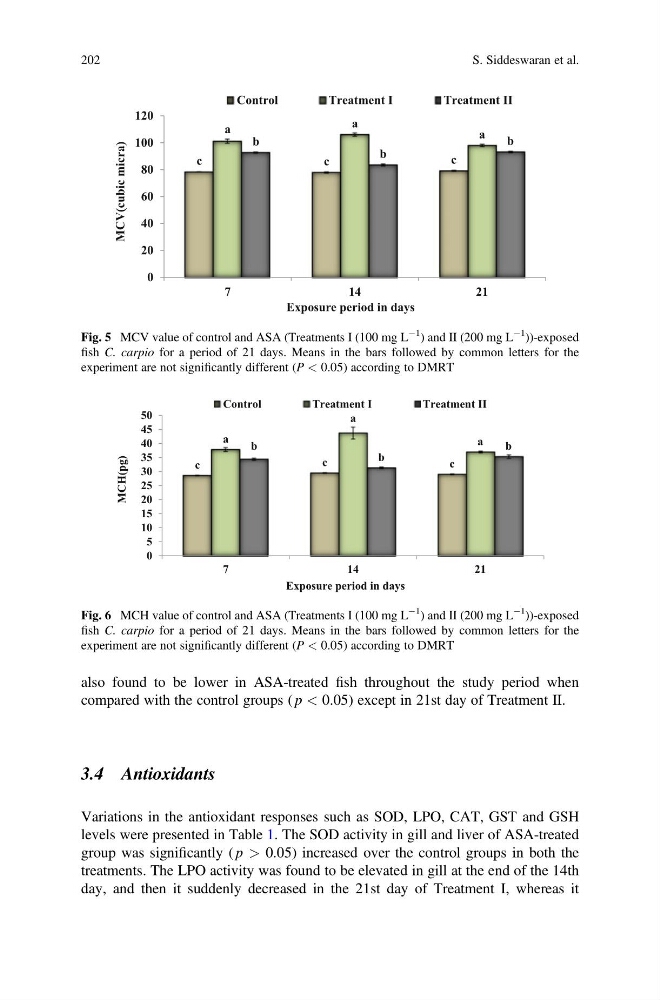
also found to be lower in ASA-treated fish throughout the study period when
compared with the control groups ( p < 0.05) except in 21st day of Treatment II.
3.4 Antioxidants
Variations in the antioxidant responses such as SOD, LPO, CAT, GST and GSH
levels were presented in Table 1. The SOD activity in gill and liver of ASA-treated
group was significantly ( p > 0.05) increased over the control groups in both the
treatments. The LPO activity was found to be elevated in gill at the end of the 14th
day, and then it suddenly decreased in the 21st day of Treatment I, whereas it
c
c
c
a
a
a
b
b
b
0
20
40
60
80
100
120
7
1 4
2 1
)
a
r
c
i
m
c
i
b
u
c
(
V
C
M
Exposure period in days
Control
Treatment I
Treatment II
Fig. 5 MCV value of control and ASA (Treatments I (100 mg L
À1
) and II (200 mg L
À1
))-exposed
fish C. carpio for a period of 21 days. Means in the bars followed by common letters for the
experiment are not significantly different (P < 0.05) according to DMRT
c
c
c
a
a
a
b
b
b
0
5
10
15
20
25
30
35
40
45
50
7
1 4
2 1
MCH(pg)
Exposure period in days
Control
Treatment I
Treatment II
Fig. 6 MCH value of control and ASA (Treatments I (100 mg L
À1
) and II (200 mg L
À1
))-exposed
fish C. carpio for a period of 21 days. Means in the bars followed by common letters for the
experiment are not significantly different (P < 0.05) according to DMRT
202
S. Siddeswaran et al.
compared with the control groups ( p < 0.05) except in 21st day of Treatment II.
3.4 Antioxidants
Variations in the antioxidant responses such as SOD, LPO, CAT, GST and GSH
levels were presented in Table 1. The SOD activity in gill and liver of ASA-treated
group was significantly ( p > 0.05) increased over the control groups in both the
treatments. The LPO activity was found to be elevated in gill at the end of the 14th
day, and then it suddenly decreased in the 21st day of Treatment I, whereas it
c
c
c
a
a
a
b
b
b
0
20
40
60
80
100
120
7
1 4
2 1
)
a
r
c
i
m
c
i
b
u
c
(
V
C
M
Exposure period in days
Control
Treatment I
Treatment II
Fig. 5 MCV value of control and ASA (Treatments I (100 mg L
À1
) and II (200 mg L
À1
))-exposed
fish C. carpio for a period of 21 days. Means in the bars followed by common letters for the
experiment are not significantly different (P < 0.05) according to DMRT
c
c
c
a
a
a
b
b
b
0
5
10
15
20
25
30
35
40
45
50
7
1 4
2 1
MCH(pg)
Exposure period in days
Control
Treatment I
Treatment II
Fig. 6 MCH value of control and ASA (Treatments I (100 mg L
À1
) and II (200 mg L
À1
))-exposed
fish C. carpio for a period of 21 days. Means in the bars followed by common letters for the
experiment are not significantly different (P < 0.05) according to DMRT
202
S. Siddeswaran et al.