

3.3 Enzymological Parameters
The changes in the transaminase activities of fish C. carpio exposed to chronic
concentrations (100 mg L
À1 - Treatment I and 200 mg L
À1 - Treatment II) of
acetylsalicylic acid (ASA) for a period of 21 days were illustrated in Figs. 10 and
11. AST activity reflected a significant decrease in ASA-treated fish comparable to
those obtained in unexposed fish 9 except 21st day in Treatment I. ALT activity was
a
a
a
b
b
b
b
b
b
0
1
2
3
4
5
6
7
1 4
2 1
m
m
.
u
c
/
s
n
o
i
l
l
i
m
C
B
R
Exposure period in days
Control
Treatment I
Treatment II
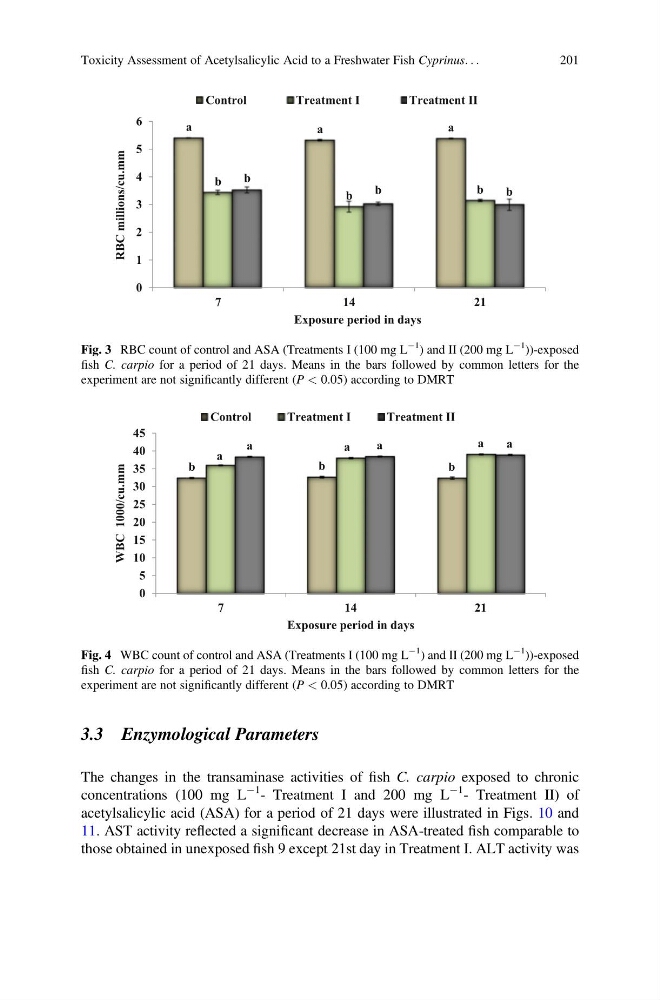
Fig. 3 RBC count of control and ASA (Treatments I (100 mg L
À1
) and II (200 mg L
À1
))-exposed
fish C. carpio for a period of 21 days. Means in the bars followed by common letters for the
experiment are not significantly different (P < 0.05) according to DMRT
b
b
b
a
a
a
a
a
a
0
5
10
15
20
25
30
35
40
45
7
1 4
2 1
m
m
.
u
c
/
0
0
0
1
C
B
W
Exposure period in days
Control
Treatment I
Treatment II
Fig. 4 WBC count of control and ASA (Treatments I (100 mg L
À1
) and II (200 mg L
À1
))-exposed
fish C. carpio for a period of 21 days. Means in the bars followed by common letters for the
experiment are not significantly different (P < 0.05) according to DMRT
Toxicity Assessment of Acetylsalicylic Acid to a Freshwater Fish Cyprinus. . .
201
The changes in the transaminase activities of fish C. carpio exposed to chronic
concentrations (100 mg L
À1 - Treatment I and 200 mg L
À1 - Treatment II) of
acetylsalicylic acid (ASA) for a period of 21 days were illustrated in Figs. 10 and
11. AST activity reflected a significant decrease in ASA-treated fish comparable to
those obtained in unexposed fish 9 except 21st day in Treatment I. ALT activity was
a
a
a
b
b
b
b
b
b
0
1
2
3
4
5
6
7
1 4
2 1
m
m
.
u
c
/
s
n
o
i
l
l
i
m
C
B
R
Exposure period in days
Control
Treatment I
Treatment II
Fig. 3 RBC count of control and ASA (Treatments I (100 mg L
À1
) and II (200 mg L
À1
))-exposed
fish C. carpio for a period of 21 days. Means in the bars followed by common letters for the
experiment are not significantly different (P < 0.05) according to DMRT
b
b
b
a
a
a
a
a
a
0
5
10
15
20
25
30
35
40
45
7
1 4
2 1
m
m
.
u
c
/
0
0
0
1
C
B
W
Exposure period in days
Control
Treatment I
Treatment II
Fig. 4 WBC count of control and ASA (Treatments I (100 mg L
À1
) and II (200 mg L
À1
))-exposed
fish C. carpio for a period of 21 days. Means in the bars followed by common letters for the
experiment are not significantly different (P < 0.05) according to DMRT
Toxicity Assessment of Acetylsalicylic Acid to a Freshwater Fish Cyprinus. . .
201