

3.2 Glucose and Protein Content
Fish exposed to ASA showed a significant increase ( p < 0.05) in plasma glucose
level throughout the study period when compared with the control groups (Fig. 8).
However, plasma protein level was found to be significantly lower in ASA-treated
fish throughout the study period when compared with the control groups (Fig. 9).
a
a
a
b
b
b
c
c
c
0
2
4
6
8
10
12
14
16
7
1 4
2 1
Hemoglobin g/dl
Exposure period in days
Control
Treatment I
Treatment II
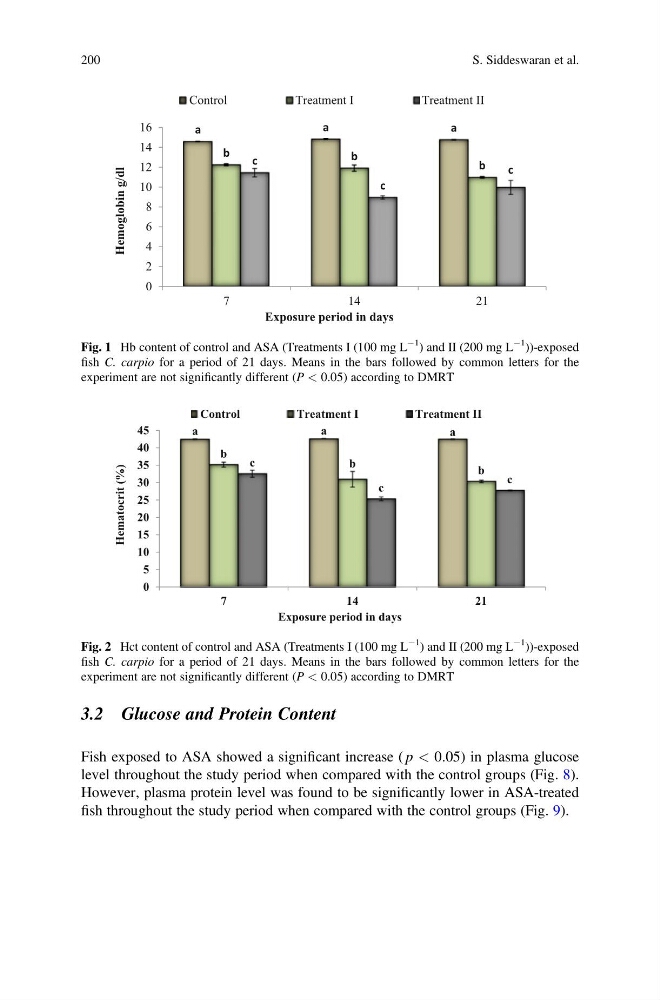
Fig. 1 Hb content of control and ASA (Treatments I (100 mg L
À1
) and II (200 mg L
À1
))-exposed
fish C. carpio for a period of 21 days. Means in the bars followed by common letters for the
experiment are not significantly different (P < 0.05) according to DMRT
a
a
a
b
b
b
c
c
c
0
5
10
15
20
25
30
35
40
45
7
1 4
2 1
Hematocrit (%)
Exposure period in days
Control
Treatment I
Treatment II
Fig. 2 Hct content of control and ASA (Treatments I (100 mg L
À1
) and II (200 mg L
À1
))-exposed
fish C. carpio for a period of 21 days. Means in the bars followed by common letters for the
experiment are not significantly different (P < 0.05) according to DMRT
200
S. Siddeswaran et al.
Fish exposed to ASA showed a significant increase ( p < 0.05) in plasma glucose
level throughout the study period when compared with the control groups (Fig. 8).
However, plasma protein level was found to be significantly lower in ASA-treated
fish throughout the study period when compared with the control groups (Fig. 9).
a
a
a
b
b
b
c
c
c
0
2
4
6
8
10
12
14
16
7
1 4
2 1
Hemoglobin g/dl
Exposure period in days
Control
Treatment I
Treatment II
Fig. 1 Hb content of control and ASA (Treatments I (100 mg L
À1
) and II (200 mg L
À1
))-exposed
fish C. carpio for a period of 21 days. Means in the bars followed by common letters for the
experiment are not significantly different (P < 0.05) according to DMRT
a
a
a
b
b
b
c
c
c
0
5
10
15
20
25
30
35
40
45
7
1 4
2 1
Hematocrit (%)
Exposure period in days
Control
Treatment I
Treatment II
Fig. 2 Hct content of control and ASA (Treatments I (100 mg L
À1
) and II (200 mg L
À1
))-exposed
fish C. carpio for a period of 21 days. Means in the bars followed by common letters for the
experiment are not significantly different (P < 0.05) according to DMRT
200
S. Siddeswaran et al.