

256
7 The Role of Ventilation in Fires and Explosions
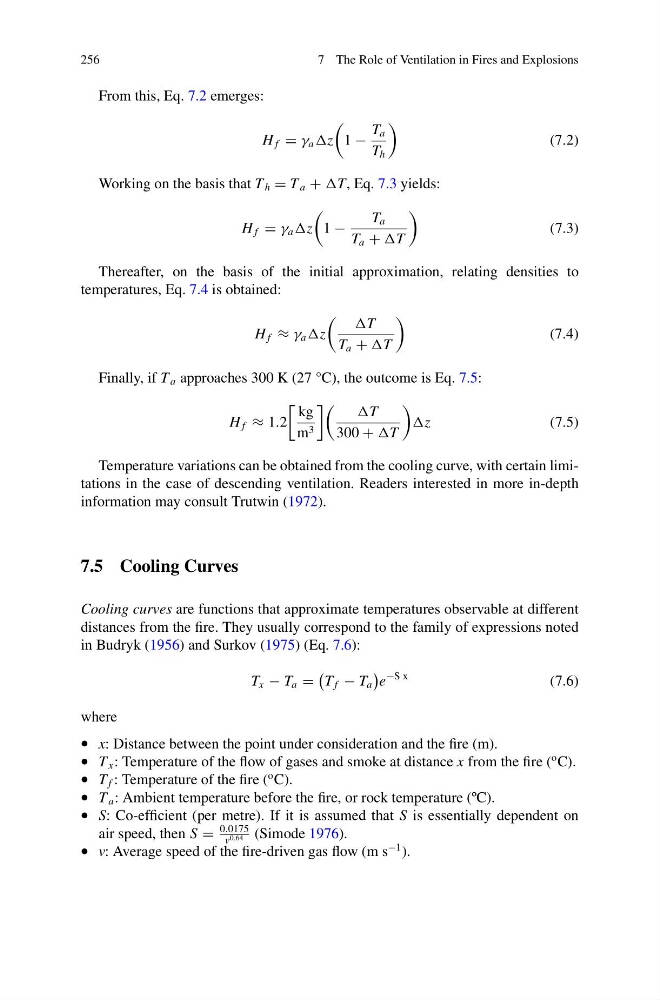
From this, Eq. 7.2 emerges:
H f = γ a z
1 −
T a
T h
(7.2)
Working on the basis that T h = T a + T, Eq. 7.3 yields:
H f = γ a z
1 −
T a
T a + T
(7.3)
Thereafter, on the basis of the initial approximation, relating densities to
temperatures, Eq. 7.4 is obtained:
H f ≈ γ a z
T
T a + T
(7.4)
Finally, if T a approaches 300 K (27 °C), the outcome is Eq. 7.5:
H f ≈ 1.2
kg
m 3
T
300 + T
z
(7.5)
Temperature variations can be obtained from the cooling curve, with certain limitations in the case of descending ventilation. Readers interested in more in-depth
information may consult Trutwin (1972).
7.5 Cooling Curves
Cooling curves are functions that approximate temperatures observable at different
distances from the fire. They usually correspond to the family of expressions noted
in Budryk (1956) and Surkov (1975) (Eq. 7.6):
T x − T a =
T f − T a
e
−S x
(7.6)
where
• x: Distance between the point under consideration and the fire (m).
• T x : Temperature of the flow of gases and smoke at distance x from the fire (
o C).
• T f : Temperature of the fire (
o C).
• T a : Ambient temperature before the fire, or rock temperature (ºC).
• S: Co-efficient (per metre). If it is assumed that S is essentially dependent on
air speed, then S =
0.0175
v 0.64 (Simode 1976).
• v: Average speed of the fire-driven gas flow (m s
−1 ).
7 The Role of Ventilation in Fires and Explosions
From this, Eq. 7.2 emerges:
H f = γ a z
1 −
T a
T h
(7.2)
Working on the basis that T h = T a + T, Eq. 7.3 yields:
H f = γ a z
1 −
T a
T a + T
(7.3)
Thereafter, on the basis of the initial approximation, relating densities to
temperatures, Eq. 7.4 is obtained:
H f ≈ γ a z
T
T a + T
(7.4)
Finally, if T a approaches 300 K (27 °C), the outcome is Eq. 7.5:
H f ≈ 1.2
kg
m 3
T
300 + T
z
(7.5)
Temperature variations can be obtained from the cooling curve, with certain limitations in the case of descending ventilation. Readers interested in more in-depth
information may consult Trutwin (1972).
7.5 Cooling Curves
Cooling curves are functions that approximate temperatures observable at different
distances from the fire. They usually correspond to the family of expressions noted
in Budryk (1956) and Surkov (1975) (Eq. 7.6):
T x − T a =
T f − T a
e
−S x
(7.6)
where
• x: Distance between the point under consideration and the fire (m).
• T x : Temperature of the flow of gases and smoke at distance x from the fire (
o C).
• T f : Temperature of the fire (
o C).
• T a : Ambient temperature before the fire, or rock temperature (ºC).
• S: Co-efficient (per metre). If it is assumed that S is essentially dependent on
air speed, then S =
0.0175
v 0.64 (Simode 1976).
• v: Average speed of the fire-driven gas flow (m s
−1 ).