

4.4 Characteristic Curve
101
4.4 Characteristic Curve
As already seen in the Atkinson equation, the pressure loss in a conduit depends
on its aerodynamic resistance (R), certain geometric parameters of the conduit, and
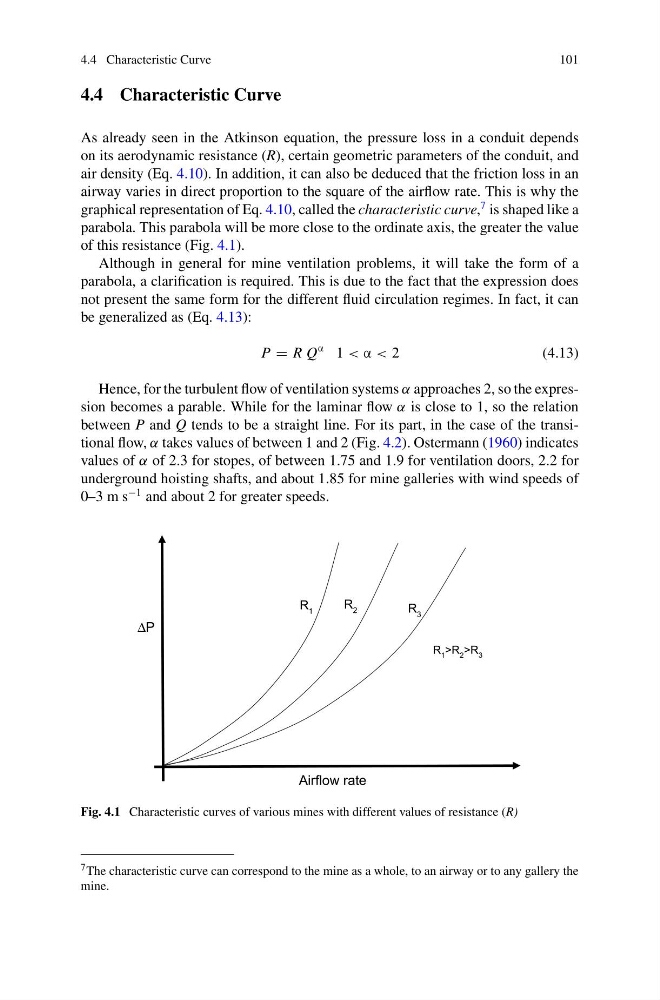
air density (Eq. 4.10). In addition, it can also be deduced that the friction loss in an
airway varies in direct proportion to the square of the airflow rate. This is why the
graphical representation of Eq. 4.10, called the characteristic curve,
7 is shaped like a
parabola. This parabola will be more close to the ordinate axis, the greater the value
of this resistance (Fig. 4.1).
Although in general for mine ventilation problems, it will take the form of a
parabola, a clarification is required. This is due to the fact that the expression does
not present the same form for the different fluid circulation regimes. In fact, it can
be generalized as (Eq. 4.13):
P = R Q
α 1 < α < 2
(4.13)
Hence, for the turbulent flow of ventilation systems α approaches 2, so the expression becomes a parable. While for the laminar flow α is close to 1, so the relation
between P and Q tends to be a straight line. For its part, in the case of the transitional flow, α takes values of between 1 and 2 (Fig. 4.2). Ostermann (1960) indicates
values of α of 2.3 for stopes, of between 1.75 and 1.9 for ventilation doors, 2.2 for
underground hoisting shafts, and about 1.85 for mine galleries with wind speeds of
0–3 m s
−1 and about 2 for greater speeds.
Airflow rate
ΔP
R 1 >R 2 >R 3
R 1
R 3
R 2
Fig. 4.1 Characteristic curves of various mines with different values of resistance (R)
7 The characteristic curve can correspond to the mine as a whole, to an airway or to any gallery the
mine.
101
4.4 Characteristic Curve
As already seen in the Atkinson equation, the pressure loss in a conduit depends
on its aerodynamic resistance (R), certain geometric parameters of the conduit, and
air density (Eq. 4.10). In addition, it can also be deduced that the friction loss in an
airway varies in direct proportion to the square of the airflow rate. This is why the
graphical representation of Eq. 4.10, called the characteristic curve,
7 is shaped like a
parabola. This parabola will be more close to the ordinate axis, the greater the value
of this resistance (Fig. 4.1).
Although in general for mine ventilation problems, it will take the form of a
parabola, a clarification is required. This is due to the fact that the expression does
not present the same form for the different fluid circulation regimes. In fact, it can
be generalized as (Eq. 4.13):
P = R Q
α 1 < α < 2
(4.13)
Hence, for the turbulent flow of ventilation systems α approaches 2, so the expression becomes a parable. While for the laminar flow α is close to 1, so the relation
between P and Q tends to be a straight line. For its part, in the case of the transitional flow, α takes values of between 1 and 2 (Fig. 4.2). Ostermann (1960) indicates
values of α of 2.3 for stopes, of between 1.75 and 1.9 for ventilation doors, 2.2 for
underground hoisting shafts, and about 1.85 for mine galleries with wind speeds of
0–3 m s
−1 and about 2 for greater speeds.
Airflow rate
ΔP
R 1 >R 2 >R 3
R 1
R 3
R 2
Fig. 4.1 Characteristic curves of various mines with different values of resistance (R)
7 The characteristic curve can correspond to the mine as a whole, to an airway or to any gallery the
mine.