

539
15.1 Axial Turbines
Angles follow from (15.1) with
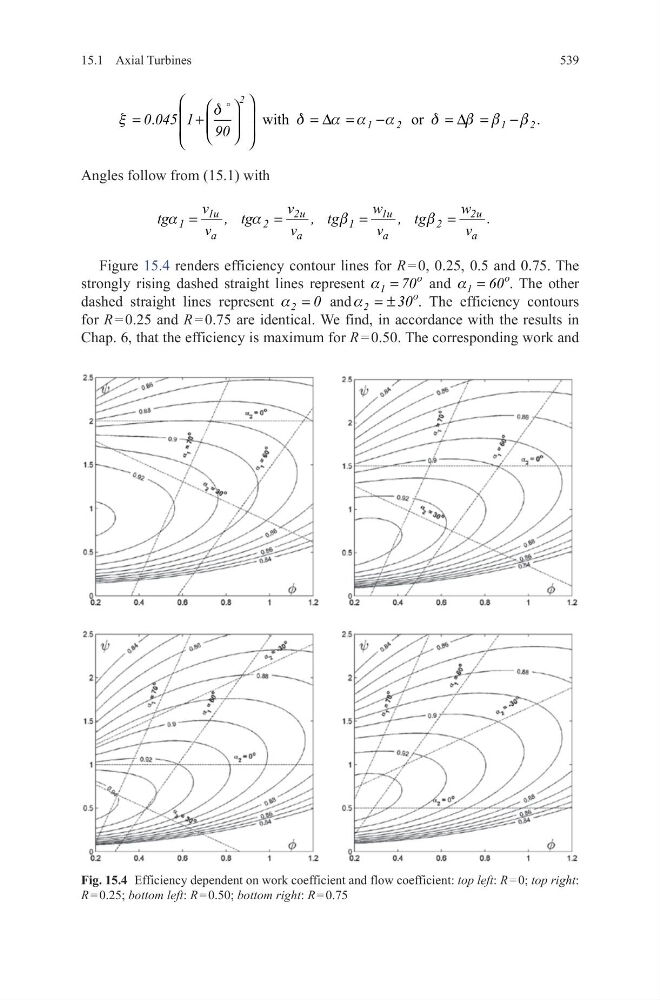
Figure 15.4 renders efficiency contour lines for R = 0, 0.25, 0.5 and 0.75. The
strongly rising dashed straight lines represent
o
1
70
a =
and
o
1
60
a =
. The other
dashed straight lines represent 2 0
a = and
o
2
30
a = ±
. The efficiency contours
for R = 0.25 and R = 0.75 are identical. We find, in accordance with the results in
Chap. 6, that the efficiency is maximum for R = 0.50. The corresponding work and
.
with
or
.
2
1
2
1
2
0 045 1 90
d
x
d
a a a
d
b b b
°
=
+
= ∆ = −
= ∆ = −
1u
2u
1u
2u
1
2
1
2
a
a
a
a
v
v
w
w
tg
, tg
, tg
, tg
.
v
v
v
v
a
a
b
b
=
=
=
=
Fig. 15.4 Efficiency dependent on work coefficient and flow coefficient: top left: R = 0; top right:
R = 0.25; bottom left: R = 0.50; bottom right: R = 0.75
15.1 Axial Turbines
Angles follow from (15.1) with
Figure 15.4 renders efficiency contour lines for R = 0, 0.25, 0.5 and 0.75. The
strongly rising dashed straight lines represent
o
1
70
a =
and
o
1
60
a =
. The other
dashed straight lines represent 2 0
a = and
o
2
30
a = ±
. The efficiency contours
for R = 0.25 and R = 0.75 are identical. We find, in accordance with the results in
Chap. 6, that the efficiency is maximum for R = 0.50. The corresponding work and
.
with
or
.
2
1
2
1
2
0 045 1 90
d
x
d
a a a
d
b b b
°
=
+
= ∆ = −
= ∆ = −
1u
2u
1u
2u
1
2
1
2
a
a
a
a
v
v
w
w
tg
, tg
, tg
, tg
.
v
v
v
v
a
a
b
b
=
=
=
=
Fig. 15.4 Efficiency dependent on work coefficient and flow coefficient: top left: R = 0; top right:
R = 0.25; bottom left: R = 0.50; bottom right: R = 0.75