

540
15 Axial and Radial Turbines for Gases
flow coefficients are small however:
0.60
y ≈
,
0.30
f ≈
. For larger values of ψ and
ϕ, efficiency is almost independent of the degree of reaction. This insensitivity is
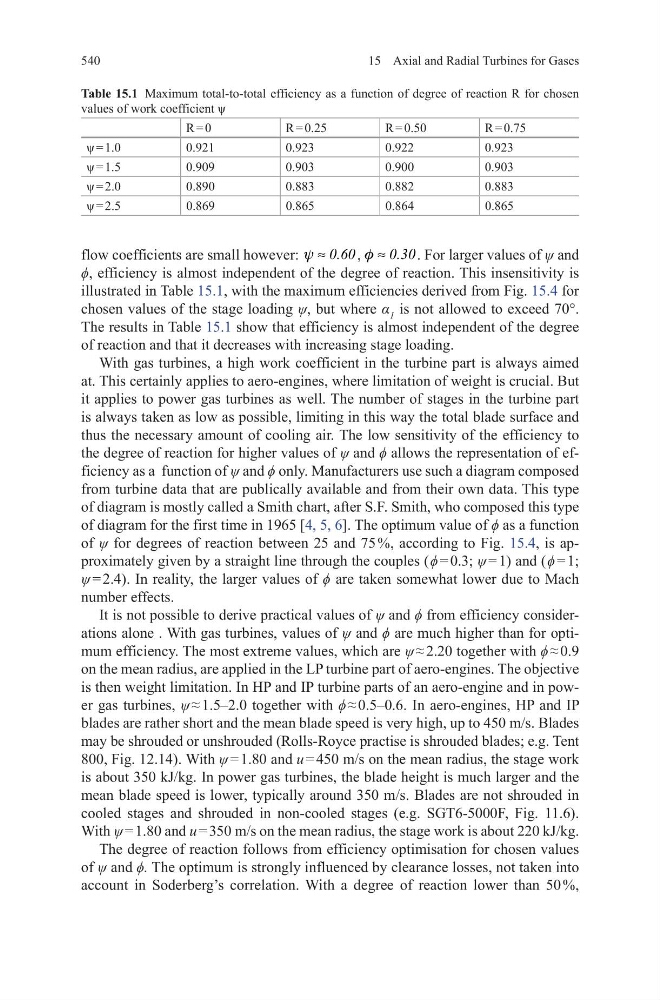
illustrated in Table 15.1, with the maximum efficiencies derived from Fig. 15.4 for
chosen values of the stage loading ψ, but where α 1 is not allowed to exceed 70°.
The results in Table 15.1 show that efficiency is almost independent of the degree
of reaction and that it decreases with increasing stage loading.
With gas turbines, a high work coefficient in the turbine part is always aimed
at. This certainly applies to aero-engines, where limitation of weight is crucial. But
it applies to power gas turbines as well. The number of stages in the turbine part
is always taken as low as possible, limiting in this way the total blade surface and
thus the necessary amount of cooling air. The low sensitivity of the efficiency to
the degree of reaction for higher values of ψ and ϕ allows the representation of efficiency as a function of ψ and ϕ only. Manufacturers use such a diagram composed
from turbine data that are publically available and from their own data. This type
of diagram is mostly called a Smith chart, after S.F. Smith, who composed this type
of diagram for the first time in 1965 [4, 5, 6]. The optimum value of ϕ as a function
of ψ for degrees of reaction between 25 and 75 %, according to Fig. 15.4, is approximately given by a straight line through the couples ( ϕ = 0.3; ψ = 1) and ( ϕ = 1;
ψ = 2.4). In reality, the larger values of ϕ are taken somewhat lower due to Mach
number effects.
It is not possible to derive practical values of ψ and ϕ from efficiency considerations alone . With gas turbines, values of ψ and ϕ are much higher than for optimum efficiency. The most extreme values, which are ψ ≈ 2.20 together with ϕ ≈ 0.9
on the mean radius, are applied in the LP turbine part of aero-engines. The objective
is then weight limitation. In HP and IP turbine parts of an aero-engine and in power gas turbines, ψ ≈ 1.5–2.0 together with ϕ ≈ 0.5–0.6. In aero-engines, HP and IP
blades are rather short and the mean blade speed is very high, up to 450 m/s. Blades
may be shrouded or unshrouded (Rolls-Royce practise is shrouded blades; e.g. Tent
800, Fig. 12.14). With ψ = 1.80 and u = 450 m/s on the mean radius, the stage work
is about 350 kJ/kg. In power gas turbines, the blade height is much larger and the
mean blade speed is lower, typically around 350 m/s. Blades are not shrouded in
cooled stages and shrouded in non-cooled stages (e.g. SGT6-5000F, Fig. 11.6).
With ψ = 1.80 and u = 350 m/s on the mean radius, the stage work is about 220 kJ/kg.
The degree of reaction follows from efficiency optimisation for chosen values
of ψ and ϕ. The optimum is strongly influenced by clearance losses, not taken into
account in Soderberg’s correlation. With a degree of reaction lower than 50 %,
Table 15.1 Maximum total-to-total efficiency as a function of degree of reaction R for chosen
values of work coefficient ψ
R = 0
R = 0.25
R = 0.50
R = 0.75
ψ = 1.0
0.921
0.923
0.922
0.923
ψ = 1.5
0.909
0.903
0.900
0.903
ψ = 2.0
0.890
0.883
0.882
0.883
ψ = 2.5
0.869
0.865
0.864
0.865
15 Axial and Radial Turbines for Gases
flow coefficients are small however:
0.60
y ≈
,
0.30
f ≈
. For larger values of ψ and
ϕ, efficiency is almost independent of the degree of reaction. This insensitivity is
illustrated in Table 15.1, with the maximum efficiencies derived from Fig. 15.4 for
chosen values of the stage loading ψ, but where α 1 is not allowed to exceed 70°.
The results in Table 15.1 show that efficiency is almost independent of the degree
of reaction and that it decreases with increasing stage loading.
With gas turbines, a high work coefficient in the turbine part is always aimed
at. This certainly applies to aero-engines, where limitation of weight is crucial. But
it applies to power gas turbines as well. The number of stages in the turbine part
is always taken as low as possible, limiting in this way the total blade surface and
thus the necessary amount of cooling air. The low sensitivity of the efficiency to
the degree of reaction for higher values of ψ and ϕ allows the representation of efficiency as a function of ψ and ϕ only. Manufacturers use such a diagram composed
from turbine data that are publically available and from their own data. This type
of diagram is mostly called a Smith chart, after S.F. Smith, who composed this type
of diagram for the first time in 1965 [4, 5, 6]. The optimum value of ϕ as a function
of ψ for degrees of reaction between 25 and 75 %, according to Fig. 15.4, is approximately given by a straight line through the couples ( ϕ = 0.3; ψ = 1) and ( ϕ = 1;
ψ = 2.4). In reality, the larger values of ϕ are taken somewhat lower due to Mach
number effects.
It is not possible to derive practical values of ψ and ϕ from efficiency considerations alone . With gas turbines, values of ψ and ϕ are much higher than for optimum efficiency. The most extreme values, which are ψ ≈ 2.20 together with ϕ ≈ 0.9
on the mean radius, are applied in the LP turbine part of aero-engines. The objective
is then weight limitation. In HP and IP turbine parts of an aero-engine and in power gas turbines, ψ ≈ 1.5–2.0 together with ϕ ≈ 0.5–0.6. In aero-engines, HP and IP
blades are rather short and the mean blade speed is very high, up to 450 m/s. Blades
may be shrouded or unshrouded (Rolls-Royce practise is shrouded blades; e.g. Tent
800, Fig. 12.14). With ψ = 1.80 and u = 450 m/s on the mean radius, the stage work
is about 350 kJ/kg. In power gas turbines, the blade height is much larger and the
mean blade speed is lower, typically around 350 m/s. Blades are not shrouded in
cooled stages and shrouded in non-cooled stages (e.g. SGT6-5000F, Fig. 11.6).
With ψ = 1.80 and u = 350 m/s on the mean radius, the stage work is about 220 kJ/kg.
The degree of reaction follows from efficiency optimisation for chosen values
of ψ and ϕ. The optimum is strongly influenced by clearance losses, not taken into
account in Soderberg’s correlation. With a degree of reaction lower than 50 %,
Table 15.1 Maximum total-to-total efficiency as a function of degree of reaction R for chosen
values of work coefficient ψ
R = 0
R = 0.25
R = 0.50
R = 0.75
ψ = 1.0
0.921
0.923
0.922
0.923
ψ = 1.5
0.909
0.903
0.900
0.903
ψ = 2.0
0.890
0.883
0.882
0.883
ψ = 2.5
0.869
0.865
0.864
0.865