

497
13.5 Performance Characteristics and Operating Range
with a loss coefficient in the order of 0.15. The high losses are the reason that, up to
now, supersonic cascades cannot be used in practise.
Pre-compression profiles, yet, may be applied efficiently to transonic cascades
with high inflow Mach number. From Fig. 13.21 it is clear that the principle of a
single normal blade passage shock becomes impractical for a high inflow Mach
number ( M 1 ~ 1.3 to 1.4). The front part of the profile then becomes extremely thin
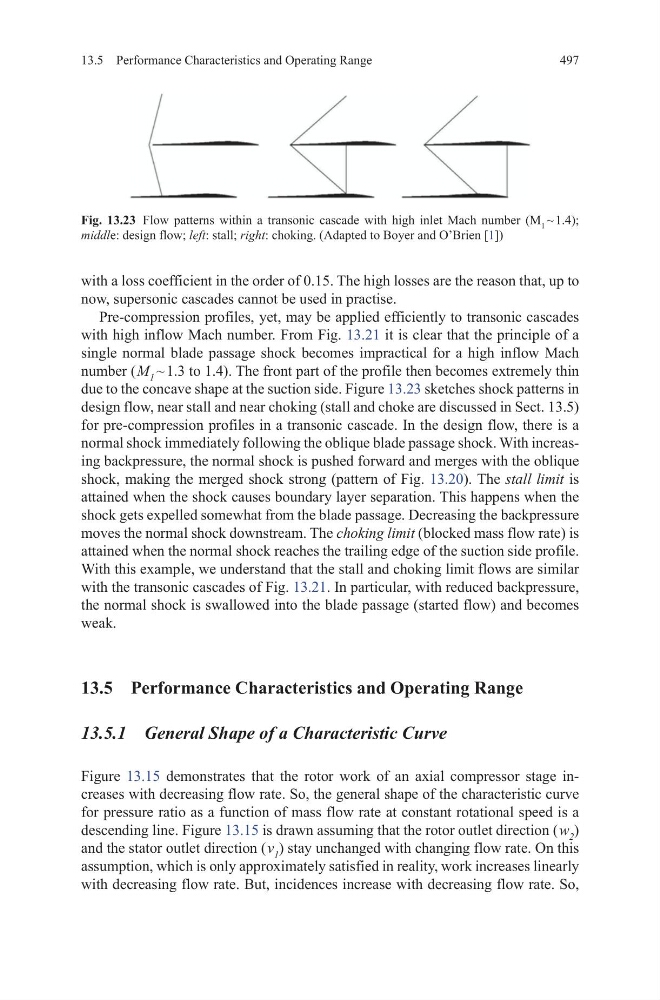
due to the concave shape at the suction side. Figure 13.23 sketches shock patterns in
design flow, near stall and near choking (stall and choke are discussed in Sect. 13.5)
for pre-compression profiles in a transonic cascade. In the design flow, there is a
normal shock immediately following the oblique blade passage shock. With increasing backpressure, the normal shock is pushed forward and merges with the oblique
shock, making the merged shock strong (pattern of Fig. 13.20). The stall limit is
attained when the shock causes boundary layer separation. This happens when the
shock gets expelled somewhat from the blade passage. Decreasing the backpressure
moves the normal shock downstream. The choking limit (blocked mass flow rate) is
attained when the normal shock reaches the trailing edge of the suction side profile.
With this example, we understand that the stall and choking limit flows are similar
with the transonic cascades of Fig. 13.21. In particular, with reduced backpressure,
the normal shock is swallowed into the blade passage (started flow) and becomes
weak.
13.5 Performance Characteristics and Operating Range
13.5.1 General Shape of a Characteristic Curve
Figure 13.15 demonstrates that the rotor work of an axial compressor stage increases with decreasing flow rate. So, the general shape of the characteristic curve
for pressure ratio as a function of mass flow rate at constant rotational speed is a
descending line. Figure 13.15 is drawn assuming that the rotor outlet direction ( w 2 )
and the stator outlet direction ( v 1 ) stay unchanged with changing flow rate. On this
assumption, which is only approximately satisfied in reality, work increases linearly
with decreasing flow rate. But, incidences increase with decreasing flow rate. So,
Fig. 13.23 Flow patterns within a transonic cascade with high inlet Mach number (M 1 ~ 1.4);
middle: design flow; left: stall; right: choking. (Adapted to Boyer and O’Brien [1])
13.5 Performance Characteristics and Operating Range
with a loss coefficient in the order of 0.15. The high losses are the reason that, up to
now, supersonic cascades cannot be used in practise.
Pre-compression profiles, yet, may be applied efficiently to transonic cascades
with high inflow Mach number. From Fig. 13.21 it is clear that the principle of a
single normal blade passage shock becomes impractical for a high inflow Mach
number ( M 1 ~ 1.3 to 1.4). The front part of the profile then becomes extremely thin
due to the concave shape at the suction side. Figure 13.23 sketches shock patterns in
design flow, near stall and near choking (stall and choke are discussed in Sect. 13.5)
for pre-compression profiles in a transonic cascade. In the design flow, there is a
normal shock immediately following the oblique blade passage shock. With increasing backpressure, the normal shock is pushed forward and merges with the oblique
shock, making the merged shock strong (pattern of Fig. 13.20). The stall limit is
attained when the shock causes boundary layer separation. This happens when the
shock gets expelled somewhat from the blade passage. Decreasing the backpressure
moves the normal shock downstream. The choking limit (blocked mass flow rate) is
attained when the normal shock reaches the trailing edge of the suction side profile.
With this example, we understand that the stall and choking limit flows are similar
with the transonic cascades of Fig. 13.21. In particular, with reduced backpressure,
the normal shock is swallowed into the blade passage (started flow) and becomes
weak.
13.5 Performance Characteristics and Operating Range
13.5.1 General Shape of a Characteristic Curve
Figure 13.15 demonstrates that the rotor work of an axial compressor stage increases with decreasing flow rate. So, the general shape of the characteristic curve
for pressure ratio as a function of mass flow rate at constant rotational speed is a
descending line. Figure 13.15 is drawn assuming that the rotor outlet direction ( w 2 )
and the stator outlet direction ( v 1 ) stay unchanged with changing flow rate. On this
assumption, which is only approximately satisfied in reality, work increases linearly
with decreasing flow rate. But, incidences increase with decreasing flow rate. So,
Fig. 13.23 Flow patterns within a transonic cascade with high inlet Mach number (M 1 ~ 1.4);
middle: design flow; left: stall; right: choking. (Adapted to Boyer and O’Brien [1])