

7 Dynamic Similitude
268
with lower efficiency for smaller pumps. So, a diagram such as Fig. 7.6 cannot have
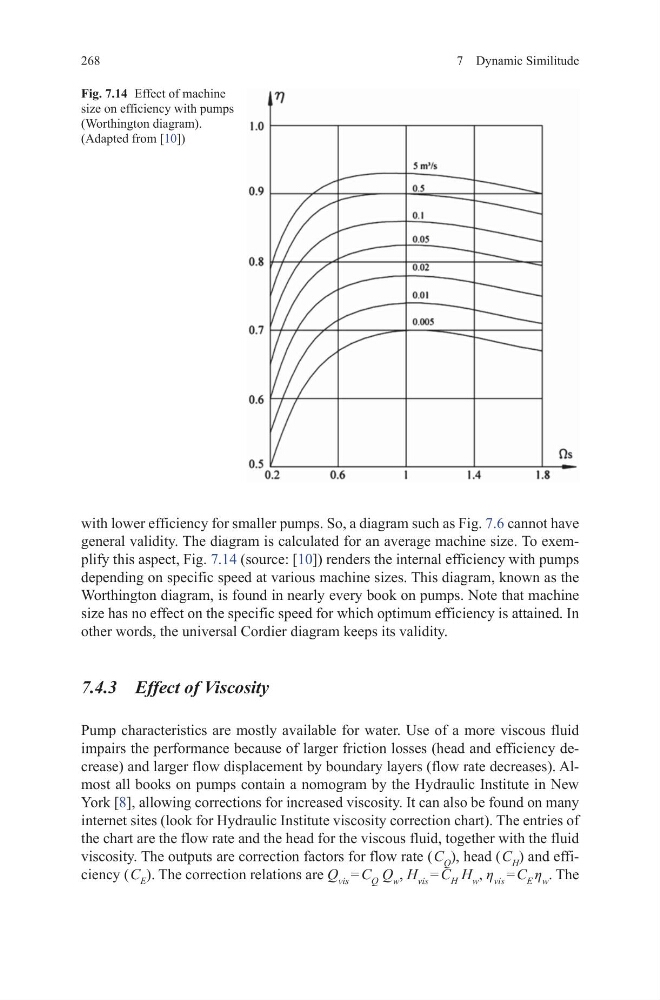
general validity. The diagram is calculated for an average machine size. To exemplify this aspect, Fig. 7.14 (source: [10]) renders the internal efficiency with pumps
depending on specific speed at various machine sizes. This diagram, known as the
Worthington diagram, is found in nearly every book on pumps. Note that machine
size has no effect on the specific speed for which optimum efficiency is attained. In
other words, the universal Cordier diagram keeps its validity.
7.4.3 Effect of Viscosity
Pump characteristics are mostly available for water. Use of a more viscous fluid
impairs the performance because of larger friction losses (head and efficiency decrease) and larger flow displacement by boundary layers (flow rate decreases). Almost all books on pumps contain a nomogram by the Hydraulic Institute in New
York [8], allowing corrections for increased viscosity. It can also be found on many
internet sites (look for Hydraulic Institute viscosity correction chart). The entries of
the chart are the flow rate and the head for the viscous fluid, together with the fluid
viscosity. The outputs are correction factors for flow rate ( C Q ), head ( C H ) and efficiency ( C E ). The correction relations are Q vis = C Q Q w , H vis = C H H w , η vis = C E η w . The
Fig. 7.14 Effect of machine
size on efficiency with pumps
(Worthington diagram).
(Adapted from [10])
268
with lower efficiency for smaller pumps. So, a diagram such as Fig. 7.6 cannot have
general validity. The diagram is calculated for an average machine size. To exemplify this aspect, Fig. 7.14 (source: [10]) renders the internal efficiency with pumps
depending on specific speed at various machine sizes. This diagram, known as the
Worthington diagram, is found in nearly every book on pumps. Note that machine
size has no effect on the specific speed for which optimum efficiency is attained. In
other words, the universal Cordier diagram keeps its validity.
7.4.3 Effect of Viscosity
Pump characteristics are mostly available for water. Use of a more viscous fluid
impairs the performance because of larger friction losses (head and efficiency decrease) and larger flow displacement by boundary layers (flow rate decreases). Almost all books on pumps contain a nomogram by the Hydraulic Institute in New
York [8], allowing corrections for increased viscosity. It can also be found on many
internet sites (look for Hydraulic Institute viscosity correction chart). The entries of
the chart are the flow rate and the head for the viscous fluid, together with the fluid
viscosity. The outputs are correction factors for flow rate ( C Q ), head ( C H ) and efficiency ( C E ). The correction relations are Q vis = C Q Q w , H vis = C H H w , η vis = C E η w . The
Fig. 7.14 Effect of machine
size on efficiency with pumps
(Worthington diagram).
(Adapted from [10])