

360
Shalabh and S. S. Dhar
model through the sum of squares due to regression. Another component explains
the contribution of random errors through the sum of squares due to errors. The
ANOVA tests the null hypothesis H 0 : β 1 = β 2 = · · · = β k = 0 against the
alternative hypothesis H 1 : β j = 0 for at least one j = 1, 2, . . . , k. Note that the
intercept term is not included in H 0 . Rejection of the null hypothesis indicates that
at least one of the explanatory variables among X 1 , X 2 , . . . , X k is a crucial variable
to remain in the model and contributes significantly in the model. The result and
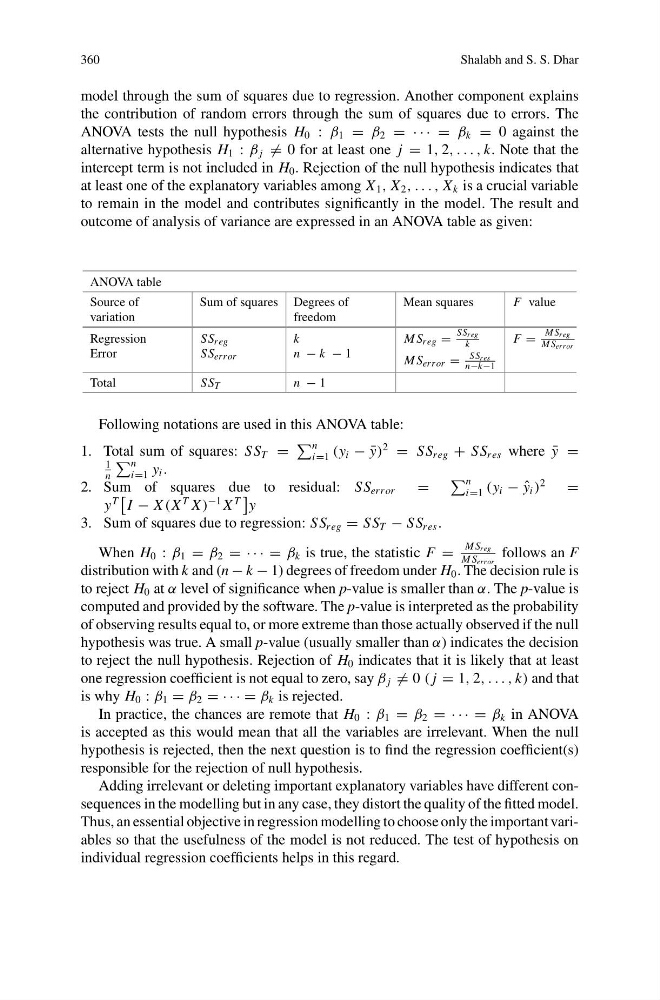
outcome of analysis of variance are expressed in an ANOVA table as given:
ANOVA table
Source of
variation
Sum of squares Degrees of
freedom
Mean squares
F value
Regression
Error
SS reg
SS err or
k
n − k − 1
M S reg =
SSreg
k
M S err or =
SSres
n−k−1
F =
M Sreg
M Serror
Total
SS T
n − 1
Following notations are used in this ANOVA table:
1. Total sum of squares: SS T =
n
i=1 (y i − ¯
y)
2
= SS reg + SS res where ¯
y =
1
n
n
i=1 y i .
2. Sum of squares due to residual: SS err or
=
n
i=1 (y i − ˆ
y i )
2
=
y
T
I − X (X
T X )
−1 X
T
y
3. Sum of squares due to regression: SS reg = SS T − SS res .
When H 0 : β 1 = β 2 = · · · = β k is true, the statistic F =
M S reg
M S err or
follows an F
distribution with k and (n − k − 1) degrees of freedom under H 0 . The decision rule is
to reject H 0 at α level of significance when p-value is smaller than α. The p-value is
computed and provided by the software. The p-value is interpreted as the probability
of observing results equal to, or more extreme than those actually observed if the null
hypothesis was true. A small p-value (usually smaller than α) indicates the decision
to reject the null hypothesis. Rejection of H 0 indicates that it is likely that at least
one regression coefficient is not equal to zero, say β j = 0 ( j = 1, 2, . . . , k) and that
is why H 0 : β 1 = β 2 = · · · = β k is rejected.
In practice, the chances are remote that H 0 : β 1 = β 2 = · · · = β k in ANOVA
is accepted as this would mean that all the variables are irrelevant. When the null
hypothesis is rejected, then the next question is to find the regression coefficient(s)
responsible for the rejection of null hypothesis.
Adding irrelevant or deleting important explanatory variables have different consequences in the modelling but in any case, they distort the quality of the fitted model.
Thus, an essential objective in regression modelling to choose only the important variables so that the usefulness of the model is not reduced. The test of hypothesis on
individual regression coefficients helps in this regard.
Shalabh and S. S. Dhar
model through the sum of squares due to regression. Another component explains
the contribution of random errors through the sum of squares due to errors. The
ANOVA tests the null hypothesis H 0 : β 1 = β 2 = · · · = β k = 0 against the
alternative hypothesis H 1 : β j = 0 for at least one j = 1, 2, . . . , k. Note that the
intercept term is not included in H 0 . Rejection of the null hypothesis indicates that
at least one of the explanatory variables among X 1 , X 2 , . . . , X k is a crucial variable
to remain in the model and contributes significantly in the model. The result and
outcome of analysis of variance are expressed in an ANOVA table as given:
ANOVA table
Source of
variation
Sum of squares Degrees of
freedom
Mean squares
F value
Regression
Error
SS reg
SS err or
k
n − k − 1
M S reg =
SSreg
k
M S err or =
SSres
n−k−1
F =
M Sreg
M Serror
Total
SS T
n − 1
Following notations are used in this ANOVA table:
1. Total sum of squares: SS T =
n
i=1 (y i − ¯
y)
2
= SS reg + SS res where ¯
y =
1
n
n
i=1 y i .
2. Sum of squares due to residual: SS err or
=
n
i=1 (y i − ˆ
y i )
2
=
y
T
I − X (X
T X )
−1 X
T
y
3. Sum of squares due to regression: SS reg = SS T − SS res .
When H 0 : β 1 = β 2 = · · · = β k is true, the statistic F =
M S reg
M S err or
follows an F
distribution with k and (n − k − 1) degrees of freedom under H 0 . The decision rule is
to reject H 0 at α level of significance when p-value is smaller than α. The p-value is
computed and provided by the software. The p-value is interpreted as the probability
of observing results equal to, or more extreme than those actually observed if the null
hypothesis was true. A small p-value (usually smaller than α) indicates the decision
to reject the null hypothesis. Rejection of H 0 indicates that it is likely that at least
one regression coefficient is not equal to zero, say β j = 0 ( j = 1, 2, . . . , k) and that
is why H 0 : β 1 = β 2 = · · · = β k is rejected.
In practice, the chances are remote that H 0 : β 1 = β 2 = · · · = β k in ANOVA
is accepted as this would mean that all the variables are irrelevant. When the null
hypothesis is rejected, then the next question is to find the regression coefficient(s)
responsible for the rejection of null hypothesis.
Adding irrelevant or deleting important explanatory variables have different consequences in the modelling but in any case, they distort the quality of the fitted model.
Thus, an essential objective in regression modelling to choose only the important variables so that the usefulness of the model is not reduced. The test of hypothesis on
individual regression coefficients helps in this regard.