

Statistical Modelling and Variable Selection in Climate Science
359
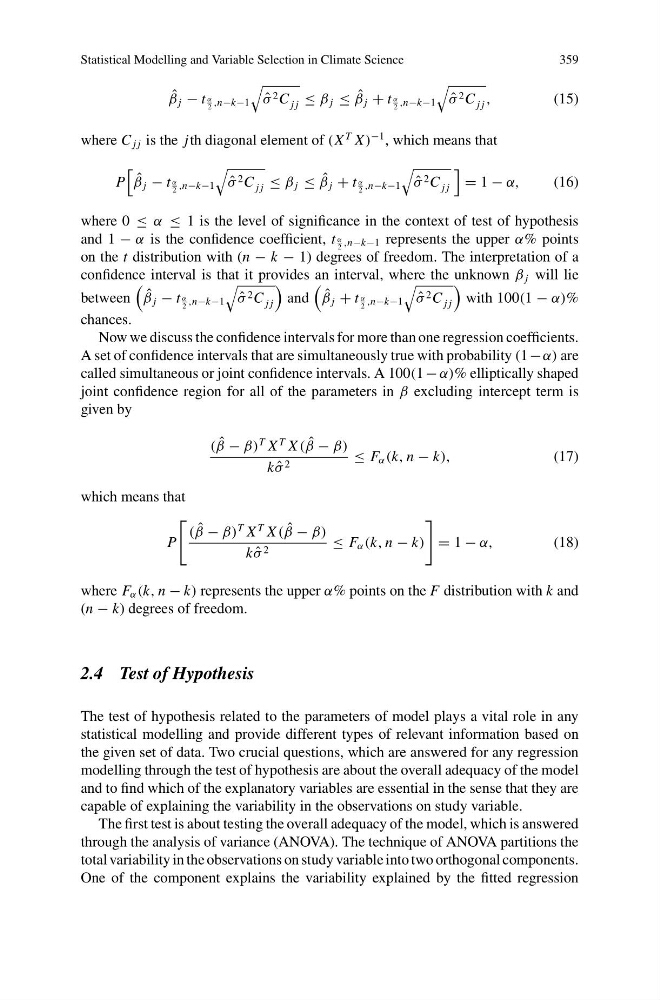
ˆ
β j − t α
2 ,n−k−1
ˆ
σ 2 C j j ≤ β j ≤ ˆ
β j + t α
2 ,n−k−1
ˆ
σ 2 C j j ,
(15)
where C j j is the jth diagonal element of (X
T X )
−1 , which means that
P
ˆ
β j − t α
2 ,n−k−1
ˆ
σ 2 C j j ≤ β j ≤ ˆ
β j + t α
2 ,n−k−1
ˆ
σ 2 C j j
= 1 − α,
(16)
where 0 ≤ α ≤ 1 is the level of significance in the context of test of hypothesis
and 1 − α is the confidence coefficient, t α
2 ,n−k−1 represents the upper α% points
on the t distribution with (n − k − 1) degrees of freedom. The interpretation of a
confidence interval is that it provides an interval, where the unknown β j will lie
between
ˆ
β j − t α
2 ,n−k−1
ˆ
σ 2 C j j
and
ˆ
β j + t α
2 ,n−k−1
ˆ
σ 2 C j j
with 100(1 − α)%
chances.
Now we discuss the confidence intervals for more than one regression coefficients.
A set of confidence intervals that are simultaneously true with probability (1 − α) are
called simultaneous or joint confidence intervals. A 100(1 − α)% elliptically shaped
joint confidence region for all of the parameters in β excluding intercept term is
given by
( ˆ
β − β)
T X
T X ( ˆ
β − β)
k ˆ
σ 2
≤ F α (k, n − k),
(17)
which means that
P
( ˆ
β − β)
T X
T X ( ˆ
β − β)
k ˆ
σ 2
≤ F α (k, n − k)
= 1 − α,
(18)
where F α (k, n − k) represents the upper α% points on the F distribution with k and
(n − k) degrees of freedom.
2.4 Test of Hypothesis
The test of hypothesis related to the parameters of model plays a vital role in any
statistical modelling and provide different types of relevant information based on
the given set of data. Two crucial questions, which are answered for any regression
modelling through the test of hypothesis are about the overall adequacy of the model
and to find which of the explanatory variables are essential in the sense that they are
capable of explaining the variability in the observations on study variable.
The first test is about testing the overall adequacy of the model, which is answered
through the analysis of variance (ANOVA). The technique of ANOVA partitions the
total variability in the observations on study variable into two orthogonal components.
One of the component explains the variability explained by the fitted regression
359
ˆ
β j − t α
2 ,n−k−1
ˆ
σ 2 C j j ≤ β j ≤ ˆ
β j + t α
2 ,n−k−1
ˆ
σ 2 C j j ,
(15)
where C j j is the jth diagonal element of (X
T X )
−1 , which means that
P
ˆ
β j − t α
2 ,n−k−1
ˆ
σ 2 C j j ≤ β j ≤ ˆ
β j + t α
2 ,n−k−1
ˆ
σ 2 C j j
= 1 − α,
(16)
where 0 ≤ α ≤ 1 is the level of significance in the context of test of hypothesis
and 1 − α is the confidence coefficient, t α
2 ,n−k−1 represents the upper α% points
on the t distribution with (n − k − 1) degrees of freedom. The interpretation of a
confidence interval is that it provides an interval, where the unknown β j will lie
between
ˆ
β j − t α
2 ,n−k−1
ˆ
σ 2 C j j
and
ˆ
β j + t α
2 ,n−k−1
ˆ
σ 2 C j j
with 100(1 − α)%
chances.
Now we discuss the confidence intervals for more than one regression coefficients.
A set of confidence intervals that are simultaneously true with probability (1 − α) are
called simultaneous or joint confidence intervals. A 100(1 − α)% elliptically shaped
joint confidence region for all of the parameters in β excluding intercept term is
given by
( ˆ
β − β)
T X
T X ( ˆ
β − β)
k ˆ
σ 2
≤ F α (k, n − k),
(17)
which means that
P
( ˆ
β − β)
T X
T X ( ˆ
β − β)
k ˆ
σ 2
≤ F α (k, n − k)
= 1 − α,
(18)
where F α (k, n − k) represents the upper α% points on the F distribution with k and
(n − k) degrees of freedom.
2.4 Test of Hypothesis
The test of hypothesis related to the parameters of model plays a vital role in any
statistical modelling and provide different types of relevant information based on
the given set of data. Two crucial questions, which are answered for any regression
modelling through the test of hypothesis are about the overall adequacy of the model
and to find which of the explanatory variables are essential in the sense that they are
capable of explaining the variability in the observations on study variable.
The first test is about testing the overall adequacy of the model, which is answered
through the analysis of variance (ANOVA). The technique of ANOVA partitions the
total variability in the observations on study variable into two orthogonal components.
One of the component explains the variability explained by the fitted regression