

Table 2 Annual temperature trends (°C year
−1 ) and precipitation trends (mm year
−1
) and at
different climatic zones during different study periods as captured by ERA-I and CRU-TS
Annual Mean Temperature
Zone Dataset
Trend year (°C/year)
(1985–2015)
Trend (1985–2000)(°C/
year)
Trend (2001–2015)(°C/
year)
LH
ERA
+0.05
∗
+0.022
+0.005
CRU
+0.03
∗
+0.12
∗
−0.72
∗
GH ERA
+0.008
∗
+0.028
−0.025
CRU
+0.037
∗
+0.16
∗
−0.082
∗
KH ERA
+0.019
∗
+0.03
+0.006
CRU
+0.046
∗
+0.17
∗
+0.12
∗
Annual precipitation
Dataset
Trend (mm/year)
(1985–2015)
Trend (1985–2000)
(mm/year)
Trend (2001–2015)
(mm/year)
LH
ERA
−65.6
−23
−12
CRU
−0.11
−4.6
+14.5
GH ERA
−20
−33
−6
CRU
−0.2
−1.05
+4
KH ERA
−12
−4
−1.8
CRU
−2.1
−4.63
−6.15
Trends with statistical significance α = 0.05, 001 and 0.001; depicted by
∗
,
∗∗ and
∗∗∗ respectively
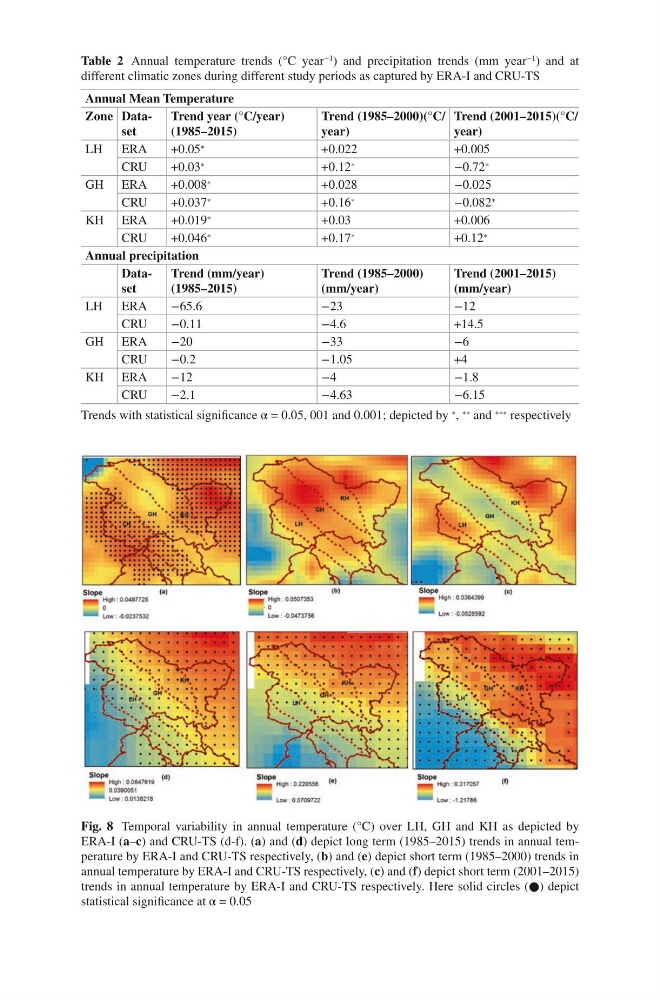
Fig. 8 Temporal variability in annual temperature (°C) over LH, GH and KH as depicted by
ERA-I (a–c) and CRU-TS (d-f). (a) and (d) depict long term (1985–2015) trends in annual temperature by ERA-I and CRU-TS respectively, (b) and (e) depict short term (1985–2000) trends in
annual temperature by ERA-I and CRU-TS respectively, (c) and (f) depict short term (2001–2015)
trends in annual temperature by ERA-I and CRU-TS respectively. Here solid circles (●) depict
statistical significance at α = 0.05
−1 ) and precipitation trends (mm year
−1
) and at
different climatic zones during different study periods as captured by ERA-I and CRU-TS
Annual Mean Temperature
Zone Dataset
Trend year (°C/year)
(1985–2015)
Trend (1985–2000)(°C/
year)
Trend (2001–2015)(°C/
year)
LH
ERA
+0.05
∗
+0.022
+0.005
CRU
+0.03
∗
+0.12
∗
−0.72
∗
GH ERA
+0.008
∗
+0.028
−0.025
CRU
+0.037
∗
+0.16
∗
−0.082
∗
KH ERA
+0.019
∗
+0.03
+0.006
CRU
+0.046
∗
+0.17
∗
+0.12
∗
Annual precipitation
Dataset
Trend (mm/year)
(1985–2015)
Trend (1985–2000)
(mm/year)
Trend (2001–2015)
(mm/year)
LH
ERA
−65.6
−23
−12
CRU
−0.11
−4.6
+14.5
GH ERA
−20
−33
−6
CRU
−0.2
−1.05
+4
KH ERA
−12
−4
−1.8
CRU
−2.1
−4.63
−6.15
Trends with statistical significance α = 0.05, 001 and 0.001; depicted by
∗
,
∗∗ and
∗∗∗ respectively
Fig. 8 Temporal variability in annual temperature (°C) over LH, GH and KH as depicted by
ERA-I (a–c) and CRU-TS (d-f). (a) and (d) depict long term (1985–2015) trends in annual temperature by ERA-I and CRU-TS respectively, (b) and (e) depict short term (1985–2000) trends in
annual temperature by ERA-I and CRU-TS respectively, (c) and (f) depict short term (2001–2015)
trends in annual temperature by ERA-I and CRU-TS respectively. Here solid circles (●) depict
statistical significance at α = 0.05