

226
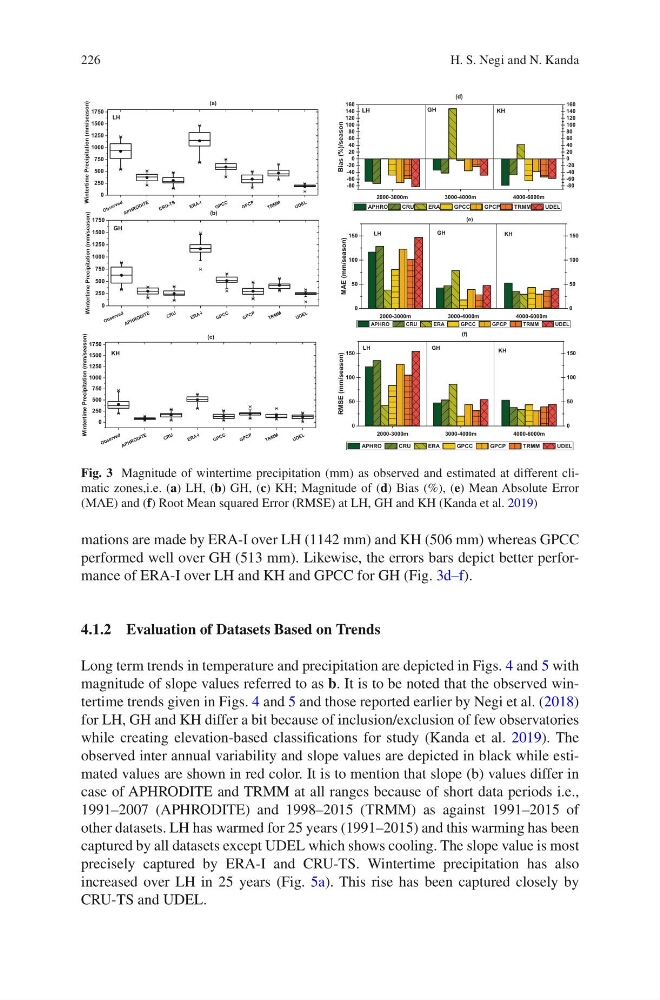
mations are made by ERA-I over LH (1142 mm) and KH (506 mm) whereas GPCC
performed well over GH (513 mm). Likewise, the errors bars depict better performance of ERA-I over LH and KH and GPCC for GH (Fig. 3d–f).
4.1.2 Evaluation of Datasets Based on Trends
Long term trends in temperature and precipitation are depicted in Figs. 4 and 5 with
magnitude of slope values referred to as b. It is to be noted that the observed wintertime trends given in Figs. 4 and 5 and those reported earlier by Negi et al. (2018)
for LH, GH and KH differ a bit because of inclusion/exclusion of few observatories
while creating elevation-based classifications for study (Kanda et al. 2019). The
observed inter annual variability and slope values are depicted in black while estimated values are shown in red color. It is to mention that slope (b) values differ in
case of APHRODITE and TRMM at all ranges because of short data periods i.e.,
1991–2007 (APHRODITE) and 1998–2015 (TRMM) as against 1991–2015 of
other datasets. LH has warmed for 25 years (1991–2015) and this warming has been
captured by all datasets except UDEL which shows cooling. The slope value is most
precisely captured by ERA-I and CRU-TS. Wintertime precipitation has also
increased over LH in 25 years (Fig. 5a). This rise has been captured closely by
CRU-TS and UDEL.
2000-3000m
3 000-4000m
4 000-6000m
0
50
100
150
0
50
100
150
APHRO
CRU
ERA
GPCC
GPCP
TRMM
UDEL
MAE (mm/season)
(e)
LH
GH
KH
2000-3000m
3000-4000m
4000-6000m
0
50
100
150
0
50
100
150
APHRO
CRU
ERA
GPCC
GPCP
TRMM
UDEL
RMSE (mm/season)
(f)
LH
GH
KH
O bs er ve d
AP HR O DI TE
CR
U- TS
ER A- I
G PC C
G PC P
TR
M M
UD EL
0
250
500
750
1000
1250
1500
1750
LH
(a)
)
n
o
s
a
e
s
/
m
m
(
n
o
i
t
a
t
i
p
i
c
e
r
P
e
m
i
t
r
e
t
n
i
W
(d)
LH
GH
KH
O bs er ve d
AP HR O DI TE
CR U
ER
A- I
G PC
C
G PC
P
TR
M M
UD EL
0
250
500
750
1000
1250
1500
1750
)
n
o
s
a
e
s
/
m
m
(
n
o
i
t
a
t
i
p
i
c
e
r
P
e
m
i
t
r
e
t
n
i
W
GH
(b)
O bs er ve d
AP HR O DI TE
CR U
ER A- I
G PC
C
G PC P
TR
M M
UD EL
0
250
500
750
1000
1250
1500
1750
)
n
o
s
a
e
s
/
m
m
(
n
o
i
t
a
t
i
p
i
c
e
r
P
e
m
i
t
r
e
t
n
i
W
KH
(c)
2000-3000m
3000-4000m
4000-6000m
-80
-60
-40
-20
0
20
40
60
80
100
120
140
160
-80
-60
-40
-20
0
20
40
60
80
100
120
140
160
Bias (%)/season
APHRO
CRU
ERA
GPCC
GPCP
TRMM
UDEL
Fig. 3 Magnitude of wintertime precipitation (mm) as observed and estimated at different climatic zones,i.e. (a) LH, (b) GH, (c) KH; Magnitude of (d) Bias (%), (e) Mean Absolute Error
(MAE) and (f) Root Mean squared Error (RMSE) at LH, GH and KH (Kanda et al. 2019)
H. S. Negi and N. Kanda
mations are made by ERA-I over LH (1142 mm) and KH (506 mm) whereas GPCC
performed well over GH (513 mm). Likewise, the errors bars depict better performance of ERA-I over LH and KH and GPCC for GH (Fig. 3d–f).
4.1.2 Evaluation of Datasets Based on Trends
Long term trends in temperature and precipitation are depicted in Figs. 4 and 5 with
magnitude of slope values referred to as b. It is to be noted that the observed wintertime trends given in Figs. 4 and 5 and those reported earlier by Negi et al. (2018)
for LH, GH and KH differ a bit because of inclusion/exclusion of few observatories
while creating elevation-based classifications for study (Kanda et al. 2019). The
observed inter annual variability and slope values are depicted in black while estimated values are shown in red color. It is to mention that slope (b) values differ in
case of APHRODITE and TRMM at all ranges because of short data periods i.e.,
1991–2007 (APHRODITE) and 1998–2015 (TRMM) as against 1991–2015 of
other datasets. LH has warmed for 25 years (1991–2015) and this warming has been
captured by all datasets except UDEL which shows cooling. The slope value is most
precisely captured by ERA-I and CRU-TS. Wintertime precipitation has also
increased over LH in 25 years (Fig. 5a). This rise has been captured closely by
CRU-TS and UDEL.
2000-3000m
3 000-4000m
4 000-6000m
0
50
100
150
0
50
100
150
APHRO
CRU
ERA
GPCC
GPCP
TRMM
UDEL
MAE (mm/season)
(e)
LH
GH
KH
2000-3000m
3000-4000m
4000-6000m
0
50
100
150
0
50
100
150
APHRO
CRU
ERA
GPCC
GPCP
TRMM
UDEL
RMSE (mm/season)
(f)
LH
GH
KH
O bs er ve d
AP HR O DI TE
CR
U- TS
ER A- I
G PC C
G PC P
TR
M M
UD EL
0
250
500
750
1000
1250
1500
1750
LH
(a)
)
n
o
s
a
e
s
/
m
m
(
n
o
i
t
a
t
i
p
i
c
e
r
P
e
m
i
t
r
e
t
n
i
W
(d)
LH
GH
KH
O bs er ve d
AP HR O DI TE
CR U
ER
A- I
G PC
C
G PC
P
TR
M M
UD EL
0
250
500
750
1000
1250
1500
1750
)
n
o
s
a
e
s
/
m
m
(
n
o
i
t
a
t
i
p
i
c
e
r
P
e
m
i
t
r
e
t
n
i
W
GH
(b)
O bs er ve d
AP HR O DI TE
CR U
ER A- I
G PC
C
G PC P
TR
M M
UD EL
0
250
500
750
1000
1250
1500
1750
)
n
o
s
a
e
s
/
m
m
(
n
o
i
t
a
t
i
p
i
c
e
r
P
e
m
i
t
r
e
t
n
i
W
KH
(c)
2000-3000m
3000-4000m
4000-6000m
-80
-60
-40
-20
0
20
40
60
80
100
120
140
160
-80
-60
-40
-20
0
20
40
60
80
100
120
140
160
Bias (%)/season
APHRO
CRU
ERA
GPCC
GPCP
TRMM
UDEL
Fig. 3 Magnitude of wintertime precipitation (mm) as observed and estimated at different climatic zones,i.e. (a) LH, (b) GH, (c) KH; Magnitude of (d) Bias (%), (e) Mean Absolute Error
(MAE) and (f) Root Mean squared Error (RMSE) at LH, GH and KH (Kanda et al. 2019)
H. S. Negi and N. Kanda