

111
In order to further examine the vertical structure of the circulation difference
between excess and deficit years, composite analysis has been carried out for excess
and deficit years and vertical cross-section of longitudinal average (between 70°E
and 79°E) for temperature (T, °C), zonal wind (u, m/s) and meridional wind (v, m/s)
are shown in Fig. 7a–c respectively. It is seen that a region of warm anomaly (~2°C)
exists over the high mountains north of 35°N during excess precipitation years as
compared to deficit years. This warm anomaly is weaker over northern Indian plains
and extend up to about 700 hPa. The vertical extent increases as one climbs the
mountain northward. At about 35°N, the warmer anomaly extends up to 400 hPa.
Therefore, the warm anomaly has a slanting structure during excess precipitation
years. Above the warm air, colder anomaly (> −2°C) exists. Similar slanting structure is also seen in zonal winds (m/s) in the difference plot of u during excess and
deficit years (Fig. 7b). A strong westerly anomaly is seen north of 35°N. Lagging
behind is an easterly anomaly region indicating that more precipitation occurs if the
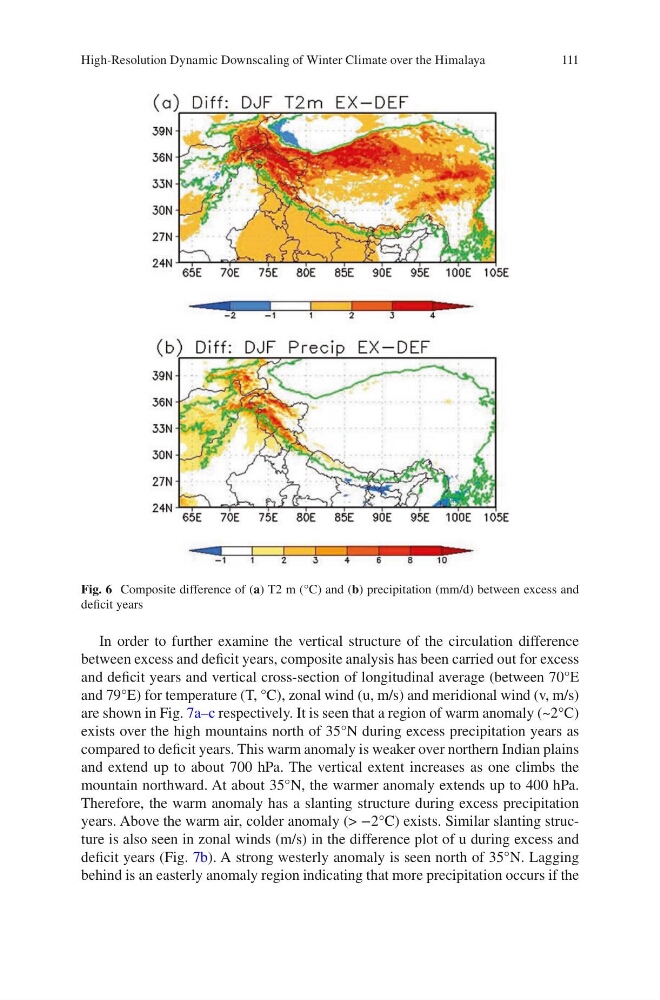
Fig. 6 Composite difference of (a) T2 m (°C) and (b) precipitation (mm/d) between excess and
deficit years
High-Resolution Dynamic Downscaling of Winter Climate over the Himalaya
In order to further examine the vertical structure of the circulation difference
between excess and deficit years, composite analysis has been carried out for excess
and deficit years and vertical cross-section of longitudinal average (between 70°E
and 79°E) for temperature (T, °C), zonal wind (u, m/s) and meridional wind (v, m/s)
are shown in Fig. 7a–c respectively. It is seen that a region of warm anomaly (~2°C)
exists over the high mountains north of 35°N during excess precipitation years as
compared to deficit years. This warm anomaly is weaker over northern Indian plains
and extend up to about 700 hPa. The vertical extent increases as one climbs the
mountain northward. At about 35°N, the warmer anomaly extends up to 400 hPa.
Therefore, the warm anomaly has a slanting structure during excess precipitation
years. Above the warm air, colder anomaly (> −2°C) exists. Similar slanting structure is also seen in zonal winds (m/s) in the difference plot of u during excess and
deficit years (Fig. 7b). A strong westerly anomaly is seen north of 35°N. Lagging
behind is an easterly anomaly region indicating that more precipitation occurs if the
Fig. 6 Composite difference of (a) T2 m (°C) and (b) precipitation (mm/d) between excess and
deficit years
High-Resolution Dynamic Downscaling of Winter Climate over the Himalaya