

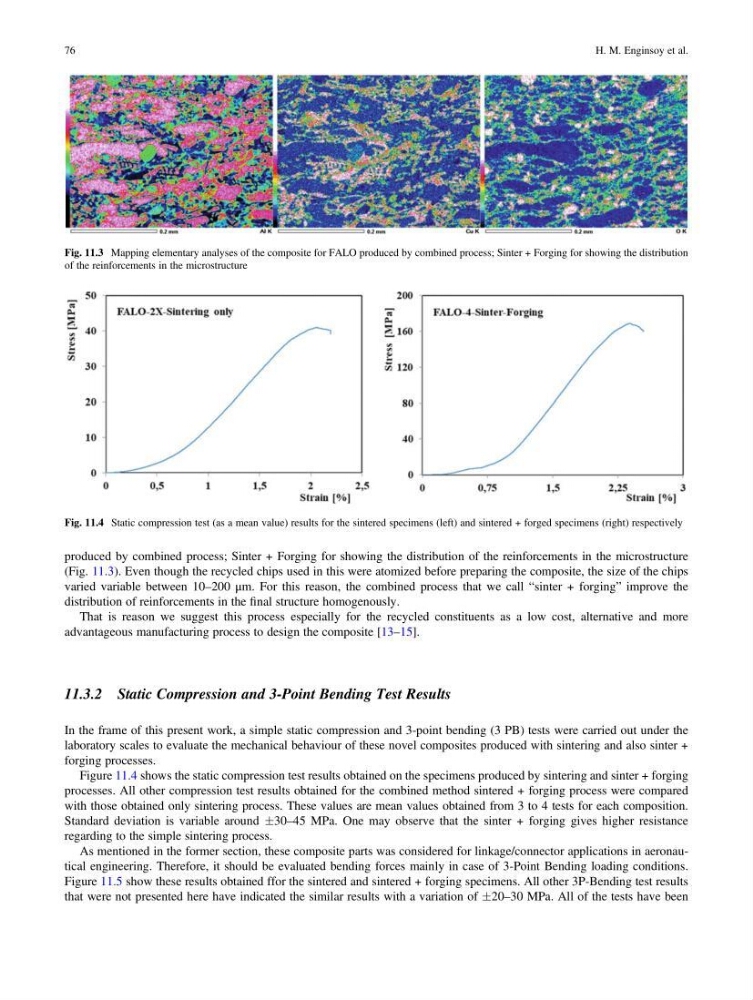
produced by combined process; Sinter + Forging for showing the distribution of the reinforcements in the microstructure
(Fig. 11.3). Even though the recycled chips used in this were atomized before preparing the composite, the size of the chips
varied variable between 10–200 μm. For this reason, the combined process that we call “sinter + forging” improve the
distribution of reinforcements in the final structure homogenously.
That is reason we suggest this process especially for the recycled constituents as a low cost, alternative and more
advantageous manufacturing process to design the composite [13–15].
11.3.2 Static Compression and 3-Point Bending Test Results
In the frame of this present work, a simple static compression and 3-point bending (3 PB) tests were carried out under the
laboratory scales to evaluate the mechanical behaviour of these novel composites produced with sintering and also sinter +
forging processes.
Figure 11.4 shows the static compression test results obtained on the specimens produced by sintering and sinter + forging
processes. All other compression test results obtained for the combined method sintered + forging process were compared
with those obtained only sintering process. These values are mean values obtained from 3 to 4 tests for each composition.
Standard deviation is variable around Æ30–45 MPa. One may observe that the sinter + forging gives higher resistance
regarding to the simple sintering process.
As mentioned in the former section, these composite parts was considered for linkage/connector applications in aeronautical engineering. Therefore, it should be evaluated bending forces mainly in case of 3-Point Bending loading conditions.
Figure 11.5 show these results obtained ffor the sintered and sintered + forging specimens. All other 3P-Bending test results
that were not presented here have indicated the similar results with a variation of Æ20–30 MPa. All of the tests have been
Fig. 11.3 Mapping elementary analyses of the composite for FALO produced by combined process; Sinter + Forging for showing the distribution
of the reinforcements in the microstructure
Fig. 11.4 Static compression test (as a mean value) results for the sintered specimens (left) and sintered + forged specimens (right) respectively
76
H. M. Enginsoy et al.
(Fig. 11.3). Even though the recycled chips used in this were atomized before preparing the composite, the size of the chips
varied variable between 10–200 μm. For this reason, the combined process that we call “sinter + forging” improve the
distribution of reinforcements in the final structure homogenously.
That is reason we suggest this process especially for the recycled constituents as a low cost, alternative and more
advantageous manufacturing process to design the composite [13–15].
11.3.2 Static Compression and 3-Point Bending Test Results
In the frame of this present work, a simple static compression and 3-point bending (3 PB) tests were carried out under the
laboratory scales to evaluate the mechanical behaviour of these novel composites produced with sintering and also sinter +
forging processes.
Figure 11.4 shows the static compression test results obtained on the specimens produced by sintering and sinter + forging
processes. All other compression test results obtained for the combined method sintered + forging process were compared
with those obtained only sintering process. These values are mean values obtained from 3 to 4 tests for each composition.
Standard deviation is variable around Æ30–45 MPa. One may observe that the sinter + forging gives higher resistance
regarding to the simple sintering process.
As mentioned in the former section, these composite parts was considered for linkage/connector applications in aeronautical engineering. Therefore, it should be evaluated bending forces mainly in case of 3-Point Bending loading conditions.
Figure 11.5 show these results obtained ffor the sintered and sintered + forging specimens. All other 3P-Bending test results
that were not presented here have indicated the similar results with a variation of Æ20–30 MPa. All of the tests have been
Fig. 11.3 Mapping elementary analyses of the composite for FALO produced by combined process; Sinter + Forging for showing the distribution
of the reinforcements in the microstructure
Fig. 11.4 Static compression test (as a mean value) results for the sintered specimens (left) and sintered + forged specimens (right) respectively
76
H. M. Enginsoy et al.