

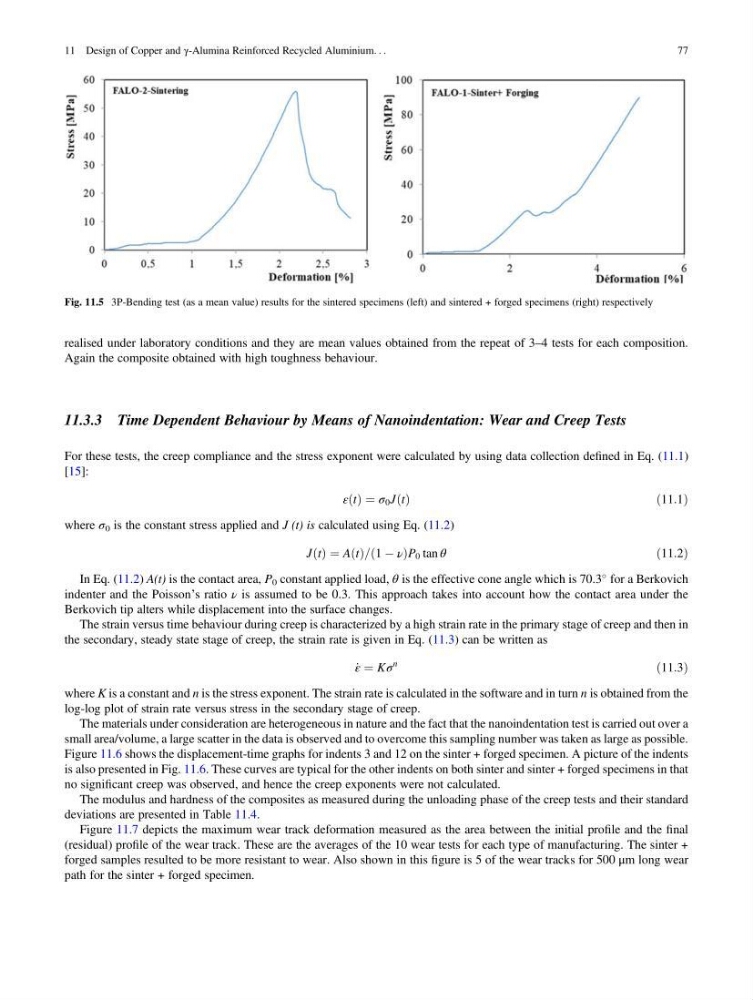
realised under laboratory conditions and they are mean values obtained from the repeat of 3–4 tests for each composition.
Again the composite obtained with high toughness behaviour.
11.3.3 Time Dependent Behaviour by Means of Nanoindentation: Wear and Creep Tests
For these tests, the creep compliance and the stress exponent were calculated by using data collection defined in Eq. (11.1)
[15]:
ε t
ð Þ ¼ σ 0 J t
ð Þ
ð11:1Þ
where σ 0 is the constant stress applied and J (t) is calculated using Eq. (11.2)
J t
ð Þ ¼ A t
ð Þ= 1 À ν
ð
ÞP 0 tan θ
ð11:2Þ
In Eq. (11.2) A(t) is the contact area, P 0 constant applied load, θ is the effective cone angle which is 70.3
for a Berkovich
indenter and the Poisson’s ratio ν is assumed to be 0.3. This approach takes into account how the contact area under the
Berkovich tip alters while displacement into the surface changes.
The strain versus time behaviour during creep is characterized by a high strain rate in the primary stage of creep and then in
the secondary, steady state stage of creep, the strain rate is given in Eq. (11.3) can be written as
_
ε ¼ Kσ
n
ð11:3Þ
where K is a constant and n is the stress exponent. The strain rate is calculated in the software and in turn n is obtained from the
log-log plot of strain rate versus stress in the secondary stage of creep.
The materials under consideration are heterogeneous in nature and the fact that the nanoindentation test is carried out over a
small area/volume, a large scatter in the data is observed and to overcome this sampling number was taken as large as possible.
Figure 11.6 shows the displacement-time graphs for indents 3 and 12 on the sinter + forged specimen. A picture of the indents
is also presented in Fig. 11.6. These curves are typical for the other indents on both sinter and sinter + forged specimens in that
no significant creep was observed, and hence the creep exponents were not calculated.
The modulus and hardness of the composites as measured during the unloading phase of the creep tests and their standard
deviations are presented in Table 11.4.
Figure 11.7 depicts the maximum wear track deformation measured as the area between the initial profile and the final
(residual) profile of the wear track. These are the averages of the 10 wear tests for each type of manufacturing. The sinter +
forged samples resulted to be more resistant to wear. Also shown in this figure is 5 of the wear tracks for 500 μm long wear
path for the sinter + forged specimen.
Fig. 11.5 3P-Bending test (as a mean value) results for the sintered specimens (left) and sintered + forged specimens (right) respectively
11 Design of Copper and γ-Alumina Reinforced Recycled Aluminium. . .
77
Again the composite obtained with high toughness behaviour.
11.3.3 Time Dependent Behaviour by Means of Nanoindentation: Wear and Creep Tests
For these tests, the creep compliance and the stress exponent were calculated by using data collection defined in Eq. (11.1)
[15]:
ε t
ð Þ ¼ σ 0 J t
ð Þ
ð11:1Þ
where σ 0 is the constant stress applied and J (t) is calculated using Eq. (11.2)
J t
ð Þ ¼ A t
ð Þ= 1 À ν
ð
ÞP 0 tan θ
ð11:2Þ
In Eq. (11.2) A(t) is the contact area, P 0 constant applied load, θ is the effective cone angle which is 70.3
for a Berkovich
indenter and the Poisson’s ratio ν is assumed to be 0.3. This approach takes into account how the contact area under the
Berkovich tip alters while displacement into the surface changes.
The strain versus time behaviour during creep is characterized by a high strain rate in the primary stage of creep and then in
the secondary, steady state stage of creep, the strain rate is given in Eq. (11.3) can be written as
_
ε ¼ Kσ
n
ð11:3Þ
where K is a constant and n is the stress exponent. The strain rate is calculated in the software and in turn n is obtained from the
log-log plot of strain rate versus stress in the secondary stage of creep.
The materials under consideration are heterogeneous in nature and the fact that the nanoindentation test is carried out over a
small area/volume, a large scatter in the data is observed and to overcome this sampling number was taken as large as possible.
Figure 11.6 shows the displacement-time graphs for indents 3 and 12 on the sinter + forged specimen. A picture of the indents
is also presented in Fig. 11.6. These curves are typical for the other indents on both sinter and sinter + forged specimens in that
no significant creep was observed, and hence the creep exponents were not calculated.
The modulus and hardness of the composites as measured during the unloading phase of the creep tests and their standard
deviations are presented in Table 11.4.
Figure 11.7 depicts the maximum wear track deformation measured as the area between the initial profile and the final
(residual) profile of the wear track. These are the averages of the 10 wear tests for each type of manufacturing. The sinter +
forged samples resulted to be more resistant to wear. Also shown in this figure is 5 of the wear tracks for 500 μm long wear
path for the sinter + forged specimen.
Fig. 11.5 3P-Bending test (as a mean value) results for the sintered specimens (left) and sintered + forged specimens (right) respectively
11 Design of Copper and γ-Alumina Reinforced Recycled Aluminium. . .
77