

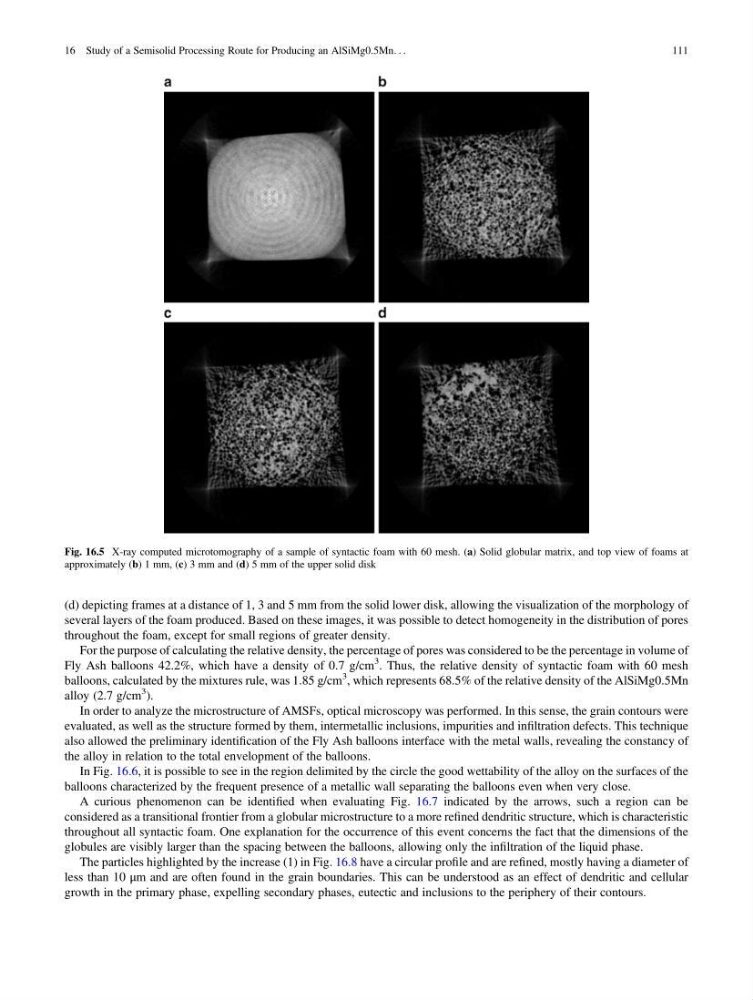
(d) depicting frames at a distance of 1, 3 and 5 mm from the solid lower disk, allowing the visualization of the morphology of
several layers of the foam produced. Based on these images, it was possible to detect homogeneity in the distribution of pores
throughout the foam, except for small regions of greater density.
For the purpose of calculating the relative density, the percentage of pores was considered to be the percentage in volume of
Fly Ash balloons 42.2%, which have a density of 0.7 g/cm
3 . Thus, the relative density of syntactic foam with 60 mesh
balloons, calculated by the mixtures rule, was 1.85 g/cm
3 , which represents 68.5% of the relative density of the AlSiMg0.5Mn
alloy (2.7 g/cm
3 ).
In order to analyze the microstructure of AMSFs, optical microscopy was performed. In this sense, the grain contours were
evaluated, as well as the structure formed by them, intermetallic inclusions, impurities and infiltration defects. This technique
also allowed the preliminary identification of the Fly Ash balloons interface with the metal walls, revealing the constancy of
the alloy in relation to the total envelopment of the balloons.
In Fig. 16.6, it is possible to see in the region delimited by the circle the good wettability of the alloy on the surfaces of the
balloons characterized by the frequent presence of a metallic wall separating the balloons even when very close.
A curious phenomenon can be identified when evaluating Fig. 16.7 indicated by the arrows, such a region can be
considered as a transitional frontier from a globular microstructure to a more refined dendritic structure, which is characteristic
throughout all syntactic foam. One explanation for the occurrence of this event concerns the fact that the dimensions of the
globules are visibly larger than the spacing between the balloons, allowing only the infiltration of the liquid phase.
The particles highlighted by the increase (1) in Fig. 16.8 have a circular profile and are refined, mostly having a diameter of
less than 10 μm and are often found in the grain boundaries. This can be understood as an effect of dendritic and cellular
growth in the primary phase, expelling secondary phases, eutectic and inclusions to the periphery of their contours.
Fig. 16.5 X-ray computed microtomography of a sample of syntactic foam with 60 mesh. (a) Solid globular matrix, and top view of foams at
approximately (b) 1 mm, (c) 3 mm and (d) 5 mm of the upper solid disk
16 Study of a Semisolid Processing Route for Producing an AlSiMg0.5Mn. . .
111
several layers of the foam produced. Based on these images, it was possible to detect homogeneity in the distribution of pores
throughout the foam, except for small regions of greater density.
For the purpose of calculating the relative density, the percentage of pores was considered to be the percentage in volume of
Fly Ash balloons 42.2%, which have a density of 0.7 g/cm
3 . Thus, the relative density of syntactic foam with 60 mesh
balloons, calculated by the mixtures rule, was 1.85 g/cm
3 , which represents 68.5% of the relative density of the AlSiMg0.5Mn
alloy (2.7 g/cm
3 ).
In order to analyze the microstructure of AMSFs, optical microscopy was performed. In this sense, the grain contours were
evaluated, as well as the structure formed by them, intermetallic inclusions, impurities and infiltration defects. This technique
also allowed the preliminary identification of the Fly Ash balloons interface with the metal walls, revealing the constancy of
the alloy in relation to the total envelopment of the balloons.
In Fig. 16.6, it is possible to see in the region delimited by the circle the good wettability of the alloy on the surfaces of the
balloons characterized by the frequent presence of a metallic wall separating the balloons even when very close.
A curious phenomenon can be identified when evaluating Fig. 16.7 indicated by the arrows, such a region can be
considered as a transitional frontier from a globular microstructure to a more refined dendritic structure, which is characteristic
throughout all syntactic foam. One explanation for the occurrence of this event concerns the fact that the dimensions of the
globules are visibly larger than the spacing between the balloons, allowing only the infiltration of the liquid phase.
The particles highlighted by the increase (1) in Fig. 16.8 have a circular profile and are refined, mostly having a diameter of
less than 10 μm and are often found in the grain boundaries. This can be understood as an effect of dendritic and cellular
growth in the primary phase, expelling secondary phases, eutectic and inclusions to the periphery of their contours.
Fig. 16.5 X-ray computed microtomography of a sample of syntactic foam with 60 mesh. (a) Solid globular matrix, and top view of foams at
approximately (b) 1 mm, (c) 3 mm and (d) 5 mm of the upper solid disk
16 Study of a Semisolid Processing Route for Producing an AlSiMg0.5Mn. . .
111