

α and ΔT are the thermal coefficient vector (
C
À1 ) and scalar temperature difference (
C). By assuming αΔT equates to dE,
and setting the temperature difference to be analogous to input voltage, arbitrary thermal coefficient elements were chosen to
mimic the morphing behavior of integrated MFC patches. Prior documentation (Barrett et al. [16], LaCroix and Ifju [3]) has
shown relative success in using this method. The development of a thermal-mechanical FE model for laminates is present in
literature and will not be covered in this work [15]. All FE models were developed and solved using ABAQUS.
15.4 MFC Patch on a 2-D Airfoil
MFC behavior on complex host structures was first observed when applied to a semi-2-D airfoil using FE methods. Due to the
difficult curvature of the airfoil, FEM was employed over analytical methods. The airfoil is 7 in. long and the leading edge was
assumed to be pinned. An MFC patch would be placed at different chordwise positions. An arbitrary fiber reinforced material
was selected for the airfoil, whereas the MFC was based on a M8528 type P1 actuator developed by Smart Material™. The
fiber orientations were specified to be parallel to the polarization direction of the MFC in order to prevent twisting kinematics
[17]. Figure 15.2 displays an FEM model with an actuated MFC placed 0.20 in. from the leading edge. The lower image
shows the airfoil in its original equilibrium while the upper image displays the resultant displacements after actuation. The
purpose of this study was to observe the increased change in camber, or difference in maximum thickness of the airfoil, while
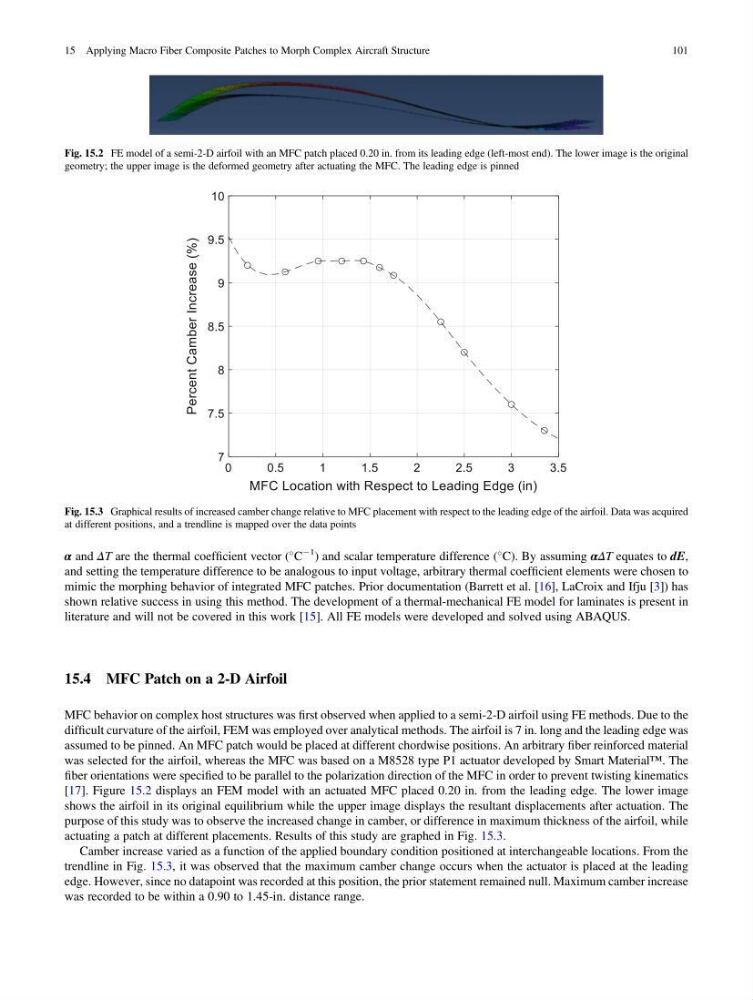
actuating a patch at different placements. Results of this study are graphed in Fig. 15.3.
Camber increase varied as a function of the applied boundary condition positioned at interchangeable locations. From the
trendline in Fig. 15.3, it was observed that the maximum camber change occurs when the actuator is placed at the leading
edge. However, since no datapoint was recorded at this position, the prior statement remained null. Maximum camber increase
was recorded to be within a 0.90 to 1.45-in. distance range.
Fig. 15.2 FE model of a semi-2-D airfoil with an MFC patch placed 0.20 in. from its leading edge (left-most end). The lower image is the original
geometry; the upper image is the deformed geometry after actuating the MFC. The leading edge is pinned
Fig. 15.3 Graphical results of increased camber change relative to MFC placement with respect to the leading edge of the airfoil. Data was acquired
at different positions, and a trendline is mapped over the data points
15 Applying Macro Fiber Composite Patches to Morph Complex Aircraft Structure
101
C
À1 ) and scalar temperature difference (
C). By assuming αΔT equates to dE,
and setting the temperature difference to be analogous to input voltage, arbitrary thermal coefficient elements were chosen to
mimic the morphing behavior of integrated MFC patches. Prior documentation (Barrett et al. [16], LaCroix and Ifju [3]) has
shown relative success in using this method. The development of a thermal-mechanical FE model for laminates is present in
literature and will not be covered in this work [15]. All FE models were developed and solved using ABAQUS.
15.4 MFC Patch on a 2-D Airfoil
MFC behavior on complex host structures was first observed when applied to a semi-2-D airfoil using FE methods. Due to the
difficult curvature of the airfoil, FEM was employed over analytical methods. The airfoil is 7 in. long and the leading edge was
assumed to be pinned. An MFC patch would be placed at different chordwise positions. An arbitrary fiber reinforced material
was selected for the airfoil, whereas the MFC was based on a M8528 type P1 actuator developed by Smart Material™. The
fiber orientations were specified to be parallel to the polarization direction of the MFC in order to prevent twisting kinematics
[17]. Figure 15.2 displays an FEM model with an actuated MFC placed 0.20 in. from the leading edge. The lower image
shows the airfoil in its original equilibrium while the upper image displays the resultant displacements after actuation. The
purpose of this study was to observe the increased change in camber, or difference in maximum thickness of the airfoil, while
actuating a patch at different placements. Results of this study are graphed in Fig. 15.3.
Camber increase varied as a function of the applied boundary condition positioned at interchangeable locations. From the
trendline in Fig. 15.3, it was observed that the maximum camber change occurs when the actuator is placed at the leading
edge. However, since no datapoint was recorded at this position, the prior statement remained null. Maximum camber increase
was recorded to be within a 0.90 to 1.45-in. distance range.
Fig. 15.2 FE model of a semi-2-D airfoil with an MFC patch placed 0.20 in. from its leading edge (left-most end). The lower image is the original
geometry; the upper image is the deformed geometry after actuating the MFC. The leading edge is pinned
Fig. 15.3 Graphical results of increased camber change relative to MFC placement with respect to the leading edge of the airfoil. Data was acquired
at different positions, and a trendline is mapped over the data points
15 Applying Macro Fiber Composite Patches to Morph Complex Aircraft Structure
101