

14.4 Experimental Validation
497
velocity field determined by the velocity method is applied on the column as a
boundary condition, as shown in Fig. 14.14b.
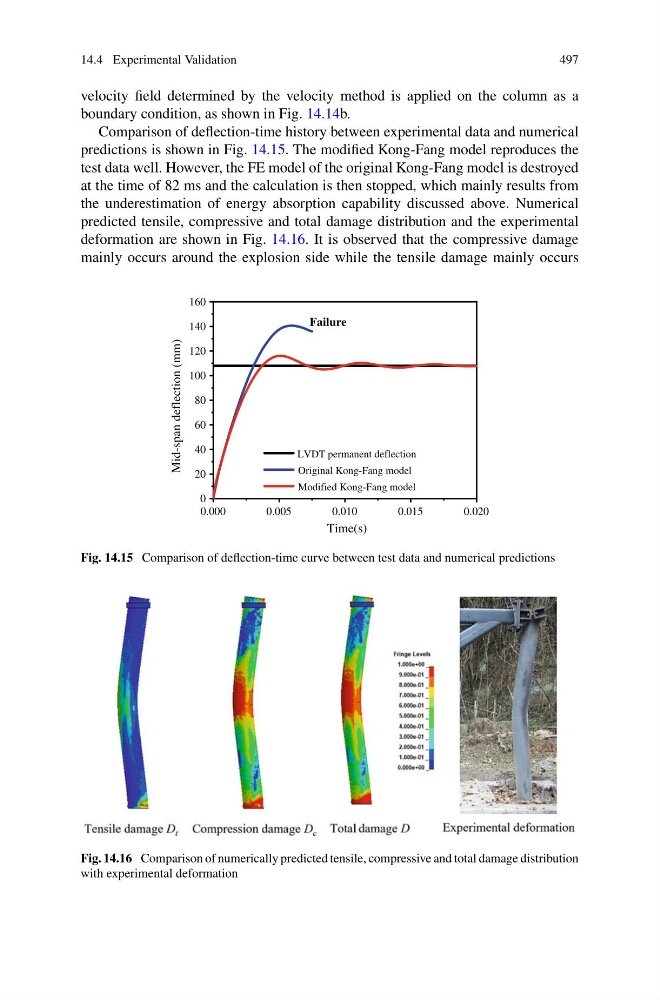
Comparison of deflection-time history between experimental data and numerical
predictions is shown in Fig. 14.15. The modified Kong-Fang model reproduces the
test data well. However, the FE model of the original Kong-Fang model is destroyed
at the time of 82 ms and the calculation is then stopped, which mainly results from
the underestimation of energy absorption capability discussed above. Numerical
predicted tensile, compressive and total damage distribution and the experimental
deformation are shown in Fig. 14.16. It is observed that the compressive damage
mainly occurs around the explosion side while the tensile damage mainly occurs
0.000
0.005
0.010
0.015
0.020
0
20
40
60
80
100
120
140
160
Mid-span deflection (mm)
Time(s)
LVDT permanent deflection
Original Kong-Fang model
Modified Kong-Fang model
Failure
Fig. 14.15 Comparison of deflection-time curve between test data and numerical predictions
Fig. 14.16 Comparison of numerically predicted tensile, compressive and total damage distribution
with experimental deformation
497
velocity field determined by the velocity method is applied on the column as a
boundary condition, as shown in Fig. 14.14b.
Comparison of deflection-time history between experimental data and numerical
predictions is shown in Fig. 14.15. The modified Kong-Fang model reproduces the
test data well. However, the FE model of the original Kong-Fang model is destroyed
at the time of 82 ms and the calculation is then stopped, which mainly results from
the underestimation of energy absorption capability discussed above. Numerical
predicted tensile, compressive and total damage distribution and the experimental
deformation are shown in Fig. 14.16. It is observed that the compressive damage
mainly occurs around the explosion side while the tensile damage mainly occurs
0.000
0.005
0.010
0.015
0.020
0
20
40
60
80
100
120
140
160
Mid-span deflection (mm)
Time(s)
LVDT permanent deflection
Original Kong-Fang model
Modified Kong-Fang model
Failure
Fig. 14.15 Comparison of deflection-time curve between test data and numerical predictions
Fig. 14.16 Comparison of numerically predicted tensile, compressive and total damage distribution
with experimental deformation