

14.4 Experimental Validation
491
0.0000 0.0025 0.0050 0.0075 0.0100 0.0125 0.0150
0
1
2
3
4
5
6
7
8
Tensile Stress(MPa)
Strain
Experimental data
Original Kong-Fang model
Modified Kong-Fang model
0.0000 0.0025 0.0050 0.0075 0.0100 0.0125 0.0150
0
1
2
3
4
5
6
7
8
Tensile Stress(MPa)
Strain
Experimental data
Original Kong-Fang model
Modified Kong-Fang model
(a)
(b)
(c)
(d)
0.0000 0.0025 0.0050 0.0075 0.0100 0.0125 0.0150
0
1
2
3
4
5
6
7
8
Tensile Stress(MPa)
Strain
Experimental data
Original Kong-Fang model
Modified Kong-Fang model
0.0000 0.0025 0.0050 0.0075 0.0100 0.0125 0.0150
0
2
4
6
8
Tensile Stress(MPa)
Strain
Experimental data
Original Kong-Fang model
Modified Kong-Fang model
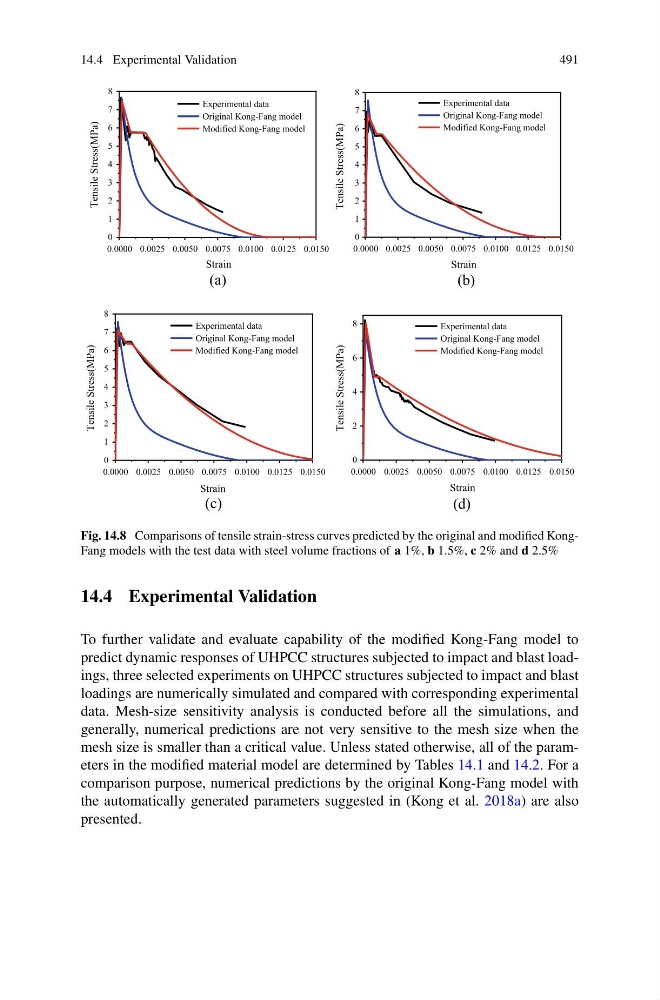
Fig. 14.8 Comparisons of tensile strain-stress curves predicted by the original and modified KongFang models with the test data with steel volume fractions of a 1%, b 1.5%, c 2% and d 2.5%
14.4 Experimental Validation
To further validate and evaluate capability of the modified Kong-Fang model to
predict dynamic responses of UHPCC structures subjected to impact and blast loadings, three selected experiments on UHPCC structures subjected to impact and blast
loadings are numerically simulated and compared with corresponding experimental
data. Mesh-size sensitivity analysis is conducted before all the simulations, and
generally, numerical predictions are not very sensitive to the mesh size when the
mesh size is smaller than a critical value. Unless stated otherwise, all of the parameters in the modified material model are determined by Tables 14.1 and 14.2. For a
comparison purpose, numerical predictions by the original Kong-Fang model with
the automatically generated parameters suggested in (Kong et al. 2018a) are also
presented.
491
0.0000 0.0025 0.0050 0.0075 0.0100 0.0125 0.0150
0
1
2
3
4
5
6
7
8
Tensile Stress(MPa)
Strain
Experimental data
Original Kong-Fang model
Modified Kong-Fang model
0.0000 0.0025 0.0050 0.0075 0.0100 0.0125 0.0150
0
1
2
3
4
5
6
7
8
Tensile Stress(MPa)
Strain
Experimental data
Original Kong-Fang model
Modified Kong-Fang model
(a)
(b)
(c)
(d)
0.0000 0.0025 0.0050 0.0075 0.0100 0.0125 0.0150
0
1
2
3
4
5
6
7
8
Tensile Stress(MPa)
Strain
Experimental data
Original Kong-Fang model
Modified Kong-Fang model
0.0000 0.0025 0.0050 0.0075 0.0100 0.0125 0.0150
0
2
4
6
8
Tensile Stress(MPa)
Strain
Experimental data
Original Kong-Fang model
Modified Kong-Fang model
Fig. 14.8 Comparisons of tensile strain-stress curves predicted by the original and modified KongFang models with the test data with steel volume fractions of a 1%, b 1.5%, c 2% and d 2.5%
14.4 Experimental Validation
To further validate and evaluate capability of the modified Kong-Fang model to
predict dynamic responses of UHPCC structures subjected to impact and blast loadings, three selected experiments on UHPCC structures subjected to impact and blast
loadings are numerically simulated and compared with corresponding experimental
data. Mesh-size sensitivity analysis is conducted before all the simulations, and
generally, numerical predictions are not very sensitive to the mesh size when the
mesh size is smaller than a critical value. Unless stated otherwise, all of the parameters in the modified material model are determined by Tables 14.1 and 14.2. For a
comparison purpose, numerical predictions by the original Kong-Fang model with
the automatically generated parameters suggested in (Kong et al. 2018a) are also
presented.