

490
14 Constitutive Modelling of UHPCC Material Under Impact …
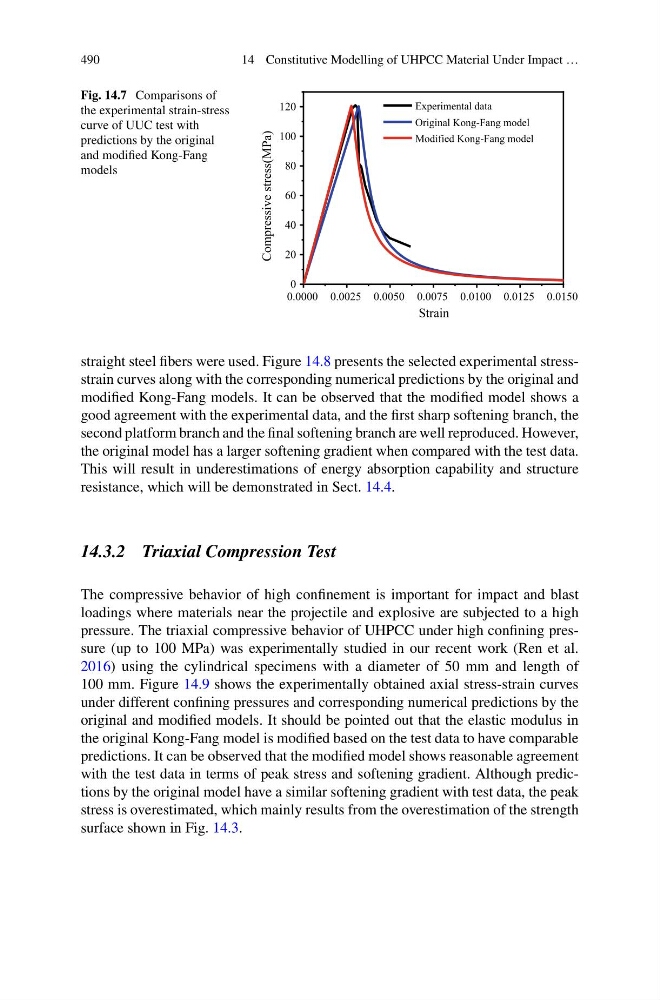
Fig. 14.7 Comparisons of
the experimental strain-stress
curve of UUC test with
predictions by the original
and modified Kong-Fang
models
0.0000 0.0025 0.0050 0.0075 0.0100 0.0125 0.0150
0
20
40
60
80
100
120
Compressive stress(MPa)
Strain
Experimental data
Original Kong-Fang model
Modified Kong-Fang model
straight steel fibers were used. Figure 14.8 presents the selected experimental stressstrain curves along with the corresponding numerical predictions by the original and
modified Kong-Fang models. It can be observed that the modified model shows a
good agreement with the experimental data, and the first sharp softening branch, the
second platform branch and the final softening branch are well reproduced. However,
the original model has a larger softening gradient when compared with the test data.
This will result in underestimations of energy absorption capability and structure
resistance, which will be demonstrated in Sect. 14.4.
14.3.2 Triaxial Compression Test
The compressive behavior of high confinement is important for impact and blast
loadings where materials near the projectile and explosive are subjected to a high
pressure. The triaxial compressive behavior of UHPCC under high confining pressure (up to 100 MPa) was experimentally studied in our recent work (Ren et al.
2016) using the cylindrical specimens with a diameter of 50 mm and length of
100 mm. Figure 14.9 shows the experimentally obtained axial stress-strain curves
under different confining pressures and corresponding numerical predictions by the
original and modified models. It should be pointed out that the elastic modulus in
the original Kong-Fang model is modified based on the test data to have comparable
predictions. It can be observed that the modified model shows reasonable agreement
with the test data in terms of peak stress and softening gradient. Although predictions by the original model have a similar softening gradient with test data, the peak
stress is overestimated, which mainly results from the overestimation of the strength
surface shown in Fig. 14.3.
14 Constitutive Modelling of UHPCC Material Under Impact …
Fig. 14.7 Comparisons of
the experimental strain-stress
curve of UUC test with
predictions by the original
and modified Kong-Fang
models
0.0000 0.0025 0.0050 0.0075 0.0100 0.0125 0.0150
0
20
40
60
80
100
120
Compressive stress(MPa)
Strain
Experimental data
Original Kong-Fang model
Modified Kong-Fang model
straight steel fibers were used. Figure 14.8 presents the selected experimental stressstrain curves along with the corresponding numerical predictions by the original and
modified Kong-Fang models. It can be observed that the modified model shows a
good agreement with the experimental data, and the first sharp softening branch, the
second platform branch and the final softening branch are well reproduced. However,
the original model has a larger softening gradient when compared with the test data.
This will result in underestimations of energy absorption capability and structure
resistance, which will be demonstrated in Sect. 14.4.
14.3.2 Triaxial Compression Test
The compressive behavior of high confinement is important for impact and blast
loadings where materials near the projectile and explosive are subjected to a high
pressure. The triaxial compressive behavior of UHPCC under high confining pressure (up to 100 MPa) was experimentally studied in our recent work (Ren et al.
2016) using the cylindrical specimens with a diameter of 50 mm and length of
100 mm. Figure 14.9 shows the experimentally obtained axial stress-strain curves
under different confining pressures and corresponding numerical predictions by the
original and modified models. It should be pointed out that the elastic modulus in
the original Kong-Fang model is modified based on the test data to have comparable
predictions. It can be observed that the modified model shows reasonable agreement
with the test data in terms of peak stress and softening gradient. Although predictions by the original model have a similar softening gradient with test data, the peak
stress is overestimated, which mainly results from the overestimation of the strength
surface shown in Fig. 14.3.