

10.7 Comparisons with Test Data
351
Table 10.7 Comparison of the numerical and experimental axial capacity of intact columns
Column Peak force (kN)
Angle of fracture plane
Height of the
fracture plane center
(mm)
Exp
Sim Dev Exp
Sim Dev Exp
Sim
I-8
4650.5
5022 8% 24.5°
25° 2%
370
403
I-9
1420
axis is about 25° which is close to the angle observed in the test. It should be noticed
that the distance between the center of the fracture plane and the bottom of the
column predicted in the numerical simulation is slightly higher than that obtained
in the experiment of I-8 column. The possible reason is that, the perfect alignment
of axial load is assumed in the numerical simulation, while in the experiment the
column may be subjected to the eccentric compressive load to some extent. In view
of the identical failure mode of the intact column under axial compressive load
between the numerical and experimental results, the accuracy of the established 3D
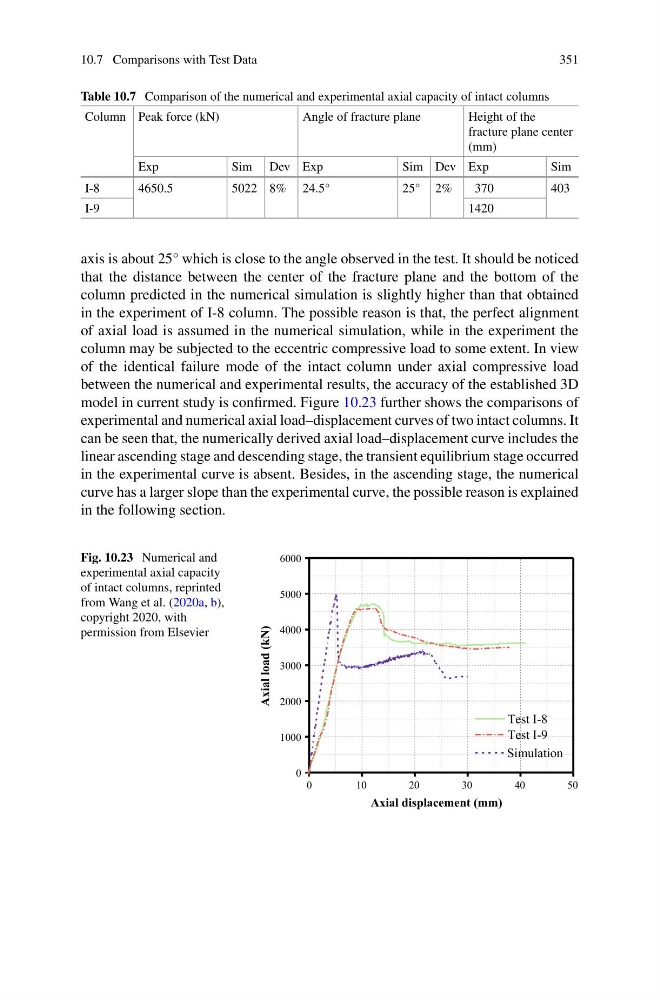
model in current study is confirmed. Figure 10.23 further shows the comparisons of
experimental and numerical axial load–displacement curves of two intact columns. It
can be seen that, the numerically derived axial load–displacement curve includes the
linear ascending stage and descending stage, the transient equilibrium stage occurred
in the experimental curve is absent. Besides, in the ascending stage, the numerical
curve has a larger slope than the experimental curve, the possible reason is explained
in the following section.
Fig. 10.23 Numerical and
experimental axial capacity
of intact columns, reprinted
from Wang et al. (2020a, b),
copyright 2020, with
permission from Elsevier
0
1 0
2 0
3 0
4 0
5 0
0
1000
2000
3000
4000
5000
6000
Simulation
Axial load (kN)
Axial displacement (mm)
Test I-8
Test I-9
351
Table 10.7 Comparison of the numerical and experimental axial capacity of intact columns
Column Peak force (kN)
Angle of fracture plane
Height of the
fracture plane center
(mm)
Exp
Sim Dev Exp
Sim Dev Exp
Sim
I-8
4650.5
5022 8% 24.5°
25° 2%
370
403
I-9
1420
axis is about 25° which is close to the angle observed in the test. It should be noticed
that the distance between the center of the fracture plane and the bottom of the
column predicted in the numerical simulation is slightly higher than that obtained
in the experiment of I-8 column. The possible reason is that, the perfect alignment
of axial load is assumed in the numerical simulation, while in the experiment the
column may be subjected to the eccentric compressive load to some extent. In view
of the identical failure mode of the intact column under axial compressive load
between the numerical and experimental results, the accuracy of the established 3D
model in current study is confirmed. Figure 10.23 further shows the comparisons of
experimental and numerical axial load–displacement curves of two intact columns. It
can be seen that, the numerically derived axial load–displacement curve includes the
linear ascending stage and descending stage, the transient equilibrium stage occurred
in the experimental curve is absent. Besides, in the ascending stage, the numerical
curve has a larger slope than the experimental curve, the possible reason is explained
in the following section.
Fig. 10.23 Numerical and
experimental axial capacity
of intact columns, reprinted
from Wang et al. (2020a, b),
copyright 2020, with
permission from Elsevier
0
1 0
2 0
3 0
4 0
5 0
0
1000
2000
3000
4000
5000
6000
Simulation
Axial load (kN)
Axial displacement (mm)
Test I-8
Test I-9