

352
10 Residual Axial Capacity of UHPCC-FST Column Under …
10.7.2.2 Post-Blast Columns (C-1, C-2)
For the present test, the core UHPCC of C-3 column in the vicinity of TNT charge
is completely crushed and suffered severe fracture after contact detonation, thus it is
regarded as completed destroyed without any residual axial capacity. Only C-1 and
C-2 columns are adopted to evaluate their residual axial capacities numerically in
this section.
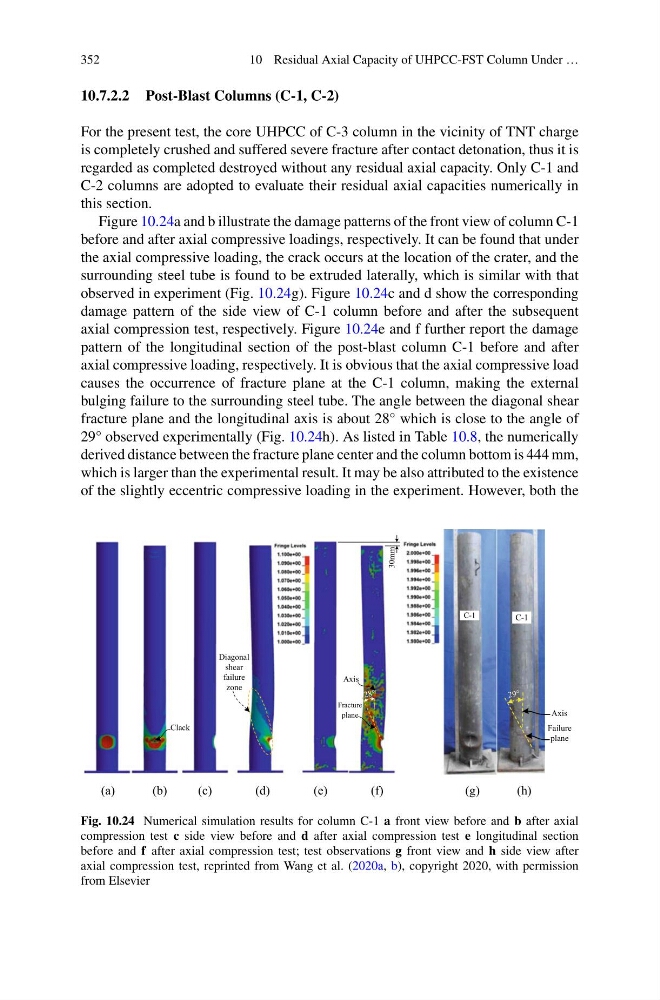
Figure 10.24a and b illustrate the damage patterns of the front view of column C-1
before and after axial compressive loadings, respectively. It can be found that under
the axial compressive loading, the crack occurs at the location of the crater, and the
surrounding steel tube is found to be extruded laterally, which is similar with that
observed in experiment (Fig. 10.24g). Figure 10.24c and d show the corresponding
damage pattern of the side view of C-1 column before and after the subsequent
axial compression test, respectively. Figure 10.24e and f further report the damage
pattern of the longitudinal section of the post-blast column C-1 before and after
axial compressive loading, respectively. It is obvious that the axial compressive load
causes the occurrence of fracture plane at the C-1 column, making the external
bulging failure to the surrounding steel tube. The angle between the diagonal shear
fracture plane and the longitudinal axis is about 28° which is close to the angle of
29° observed experimentally (Fig. 10.24h). As listed in Table 10.8, the numerically
derived distance between the fracture plane center and the column bottom is 444 mm,
which is larger than the experimental result. It may be also attributed to the existence
of the slightly eccentric compressive loading in the experiment. However, both the
Diagonal
shear
failure
zone
Axis
Fracture
plane
30mm
Clack
C-1
C-1
Failure
plane
Axis
(a)
(b)
(c)
(d)
(e)
(f)
(g)
(h)
Fig. 10.24 Numerical simulation results for column C-1 a front view before and b after axial
compression test c side view before and d after axial compression test e longitudinal section
before and f after axial compression test; test observations g front view and h side view after
axial compression test, reprinted from Wang et al. (2020a, b), copyright 2020, with permission
from Elsevier
10 Residual Axial Capacity of UHPCC-FST Column Under …
10.7.2.2 Post-Blast Columns (C-1, C-2)
For the present test, the core UHPCC of C-3 column in the vicinity of TNT charge
is completely crushed and suffered severe fracture after contact detonation, thus it is
regarded as completed destroyed without any residual axial capacity. Only C-1 and
C-2 columns are adopted to evaluate their residual axial capacities numerically in
this section.
Figure 10.24a and b illustrate the damage patterns of the front view of column C-1
before and after axial compressive loadings, respectively. It can be found that under
the axial compressive loading, the crack occurs at the location of the crater, and the
surrounding steel tube is found to be extruded laterally, which is similar with that
observed in experiment (Fig. 10.24g). Figure 10.24c and d show the corresponding
damage pattern of the side view of C-1 column before and after the subsequent
axial compression test, respectively. Figure 10.24e and f further report the damage
pattern of the longitudinal section of the post-blast column C-1 before and after
axial compressive loading, respectively. It is obvious that the axial compressive load
causes the occurrence of fracture plane at the C-1 column, making the external
bulging failure to the surrounding steel tube. The angle between the diagonal shear
fracture plane and the longitudinal axis is about 28° which is close to the angle of
29° observed experimentally (Fig. 10.24h). As listed in Table 10.8, the numerically
derived distance between the fracture plane center and the column bottom is 444 mm,
which is larger than the experimental result. It may be also attributed to the existence
of the slightly eccentric compressive loading in the experiment. However, both the
Diagonal
shear
failure
zone
Axis
Fracture
plane
30mm
Clack
C-1
C-1
Failure
plane
Axis
(a)
(b)
(c)
(d)
(e)
(f)
(g)
(h)
Fig. 10.24 Numerical simulation results for column C-1 a front view before and b after axial
compression test c side view before and d after axial compression test e longitudinal section
before and f after axial compression test; test observations g front view and h side view after
axial compression test, reprinted from Wang et al. (2020a, b), copyright 2020, with permission
from Elsevier