

342
10 Residual Axial Capacity of UHPCC-FST Column Under …
the experimental curve and the post-peak behavior of the simulation curve can be
improved. Further considering the prediction accuracy of the contact explosion and
the following post-blast axial compression tests, by trial and error, and the softening
factor b 2 of present UHPCC material is determined as −5.5.
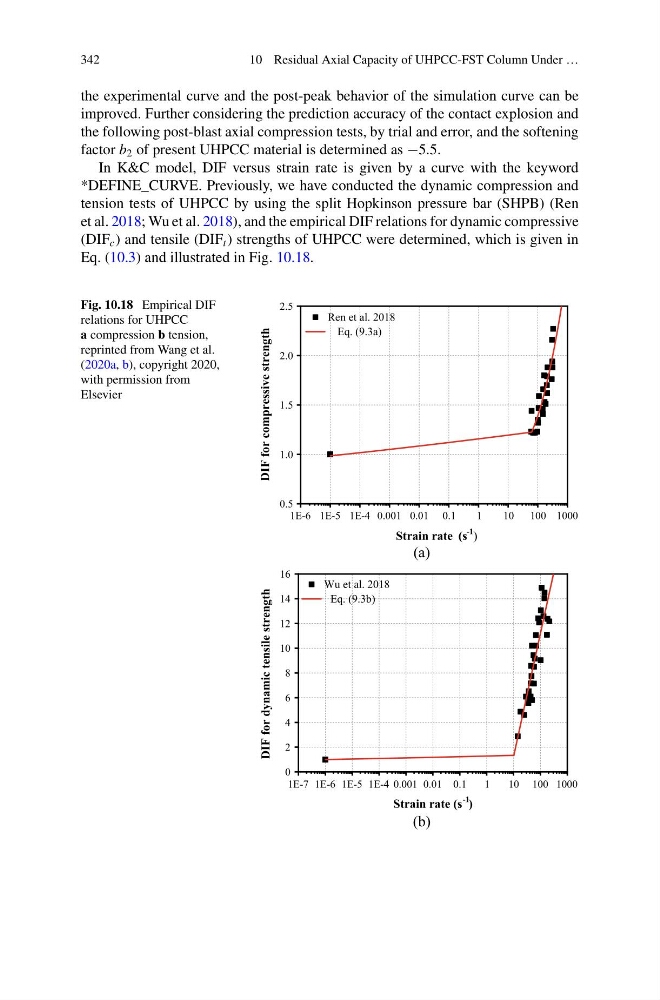
In K&C model, DIF versus strain rate is given by a curve with the keyword
*DEFINE_CURVE. Previously, we have conducted the dynamic compression and
tension tests of UHPCC by using the split Hopkinson pressure bar (SHPB) (Ren
et al. 2018; Wu et al. 2018), and the empirical DIF relations for dynamic compressive
(DIF c ) and tensile (DIF t ) strengths of UHPCC were determined, which is given in
Eq. (10.3) and illustrated in Fig. 10.18.
Fig. 10.18 Empirical DIF
relations for UHPCC
a compression b tension,
reprinted from Wang et al.
(2020a, b), copyright 2020,
with permission from
Elsevier
1E-6 1E-5 1E-4 0.001 0.01 0.1
1
10
100 1000
0.5
1.0
1.5
2.0
2.5
DIF for compressive strength
Ren et al. 2018
Eq. (9.3a)
Strain rate (s
-1
(a)
1E-7 1E-6 1E-5 1E-4 0.001 0.01 0.1
1
10 100 1000
0
2
4
6
8
10
12
14
16
DIF for dynamic tensile strength
Wu et al. 2018
Eq. (9.3b)
Strain rate (s
-1
)
(b)
)
10 Residual Axial Capacity of UHPCC-FST Column Under …
the experimental curve and the post-peak behavior of the simulation curve can be
improved. Further considering the prediction accuracy of the contact explosion and
the following post-blast axial compression tests, by trial and error, and the softening
factor b 2 of present UHPCC material is determined as −5.5.
In K&C model, DIF versus strain rate is given by a curve with the keyword
*DEFINE_CURVE. Previously, we have conducted the dynamic compression and
tension tests of UHPCC by using the split Hopkinson pressure bar (SHPB) (Ren
et al. 2018; Wu et al. 2018), and the empirical DIF relations for dynamic compressive
(DIF c ) and tensile (DIF t ) strengths of UHPCC were determined, which is given in
Eq. (10.3) and illustrated in Fig. 10.18.
Fig. 10.18 Empirical DIF
relations for UHPCC
a compression b tension,
reprinted from Wang et al.
(2020a, b), copyright 2020,
with permission from
Elsevier
1E-6 1E-5 1E-4 0.001 0.01 0.1
1
10
100 1000
0.5
1.0
1.5
2.0
2.5
DIF for compressive strength
Ren et al. 2018
Eq. (9.3a)
Strain rate (s
-1
(a)
1E-7 1E-6 1E-5 1E-4 0.001 0.01 0.1
1
10 100 1000
0
2
4
6
8
10
12
14
16
DIF for dynamic tensile strength
Wu et al. 2018
Eq. (9.3b)
Strain rate (s
-1
)
(b)
)