

10.6 Numerical Simulation
341
Table 10.4 Default and modified values of K&C model parameters for present UHPCC
Parameters
f c (MPa)
f t (MPa)
b 1
b 2
Density ρ
Poisson’s ratio υ
Default value
121
7.4
1.6
1.35
2480 kg/m 3
0.23
Modified values
121
9
1
−5.5
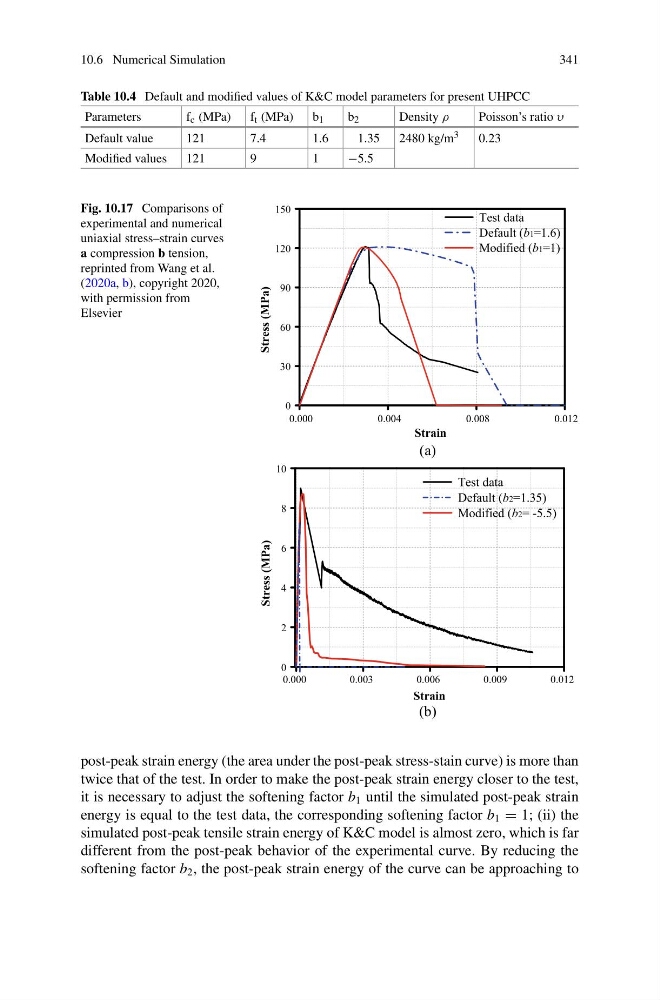
Fig. 10.17 Comparisons of
experimental and numerical
uniaxial stress–strain curves
a compression b tension,
reprinted from Wang et al.
(2020a, b), copyright 2020,
with permission from
Elsevier
0.000
0.004
0.008
0.012
0
30
60
90
120
150
Stress (MPa)
Strain
Test data
Default (b1=1.6)
Modified (b1=1)
(a)
0.000
0.003
0.006
0.009
0.012
0
2
4
6
8
10
Stress (MPa)
Strain
Test data
Default (b2=1.35)
Modified (b2= -5.5)
(b)
post-peak strain energy (the area under the post-peak stress-stain curve) is more than
twice that of the test. In order to make the post-peak strain energy closer to the test,
it is necessary to adjust the softening factor b 1 until the simulated post-peak strain
energy is equal to the test data, the corresponding softening factor b 1 = 1; (ii) the
simulated post-peak tensile strain energy of K&C model is almost zero, which is far
different from the post-peak behavior of the experimental curve. By reducing the
softening factor b 2 , the post-peak strain energy of the curve can be approaching to
341
Table 10.4 Default and modified values of K&C model parameters for present UHPCC
Parameters
f c (MPa)
f t (MPa)
b 1
b 2
Density ρ
Poisson’s ratio υ
Default value
121
7.4
1.6
1.35
2480 kg/m 3
0.23
Modified values
121
9
1
−5.5
Fig. 10.17 Comparisons of
experimental and numerical
uniaxial stress–strain curves
a compression b tension,
reprinted from Wang et al.
(2020a, b), copyright 2020,
with permission from
Elsevier
0.000
0.004
0.008
0.012
0
30
60
90
120
150
Stress (MPa)
Strain
Test data
Default (b1=1.6)
Modified (b1=1)
(a)
0.000
0.003
0.006
0.009
0.012
0
2
4
6
8
10
Stress (MPa)
Strain
Test data
Default (b2=1.35)
Modified (b2= -5.5)
(b)
post-peak strain energy (the area under the post-peak stress-stain curve) is more than
twice that of the test. In order to make the post-peak strain energy closer to the test,
it is necessary to adjust the softening factor b 1 until the simulated post-peak strain
energy is equal to the test data, the corresponding softening factor b 1 = 1; (ii) the
simulated post-peak tensile strain energy of K&C model is almost zero, which is far
different from the post-peak behavior of the experimental curve. By reducing the
softening factor b 2 , the post-peak strain energy of the curve can be approaching to