

340
10 Residual Axial Capacity of UHPCC-FST Column Under …
300
300
100
100
100
100
200
50
50
(a)
(b)
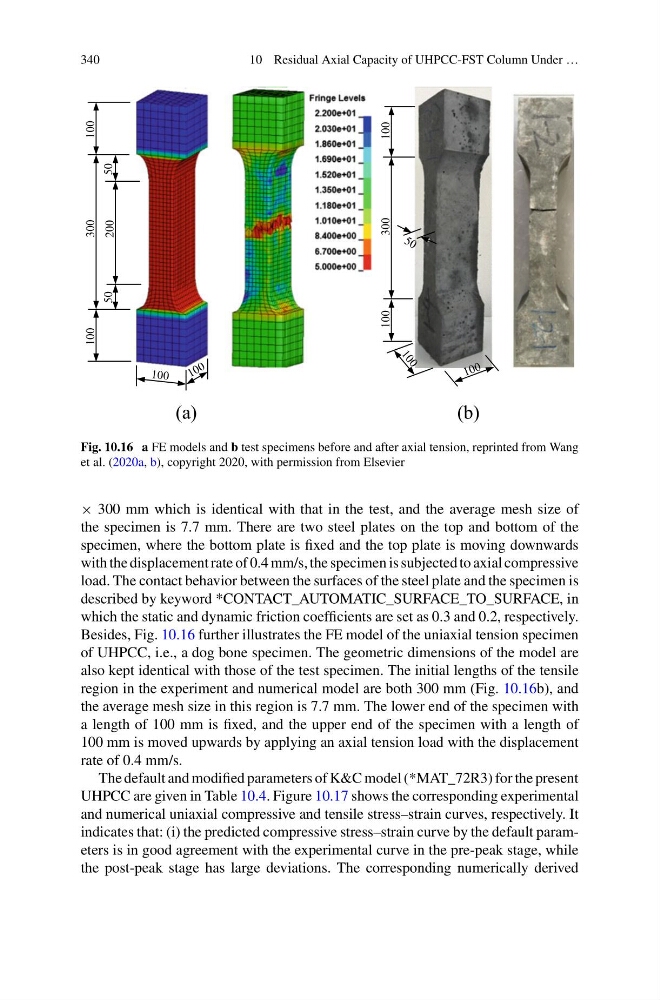
Fig. 10.16 a FE models and b test specimens before and after axial tension, reprinted from Wang
et al. (2020a, b), copyright 2020, with permission from Elsevier
× 300 mm which is identical with that in the test, and the average mesh size of
the specimen is 7.7 mm. There are two steel plates on the top and bottom of the
specimen, where the bottom plate is fixed and the top plate is moving downwards
with the displacement rate of 0.4 mm/s, the specimen is subjected to axial compressive
load. The contact behavior between the surfaces of the steel plate and the specimen is
described by keyword *CONTACT_AUTOMATIC_SURFACE_TO_SURFACE, in
which the static and dynamic friction coefficients are set as 0.3 and 0.2, respectively.
Besides, Fig. 10.16 further illustrates the FE model of the uniaxial tension specimen
of UHPCC, i.e., a dog bone specimen. The geometric dimensions of the model are
also kept identical with those of the test specimen. The initial lengths of the tensile
region in the experiment and numerical model are both 300 mm (Fig. 10.16b), and
the average mesh size in this region is 7.7 mm. The lower end of the specimen with
a length of 100 mm is fixed, and the upper end of the specimen with a length of
100 mm is moved upwards by applying an axial tension load with the displacement
rate of 0.4 mm/s.
The default and modified parameters of K&C model (*MAT_72R3) for the present
UHPCC are given in Table 10.4. Figure 10.17 shows the corresponding experimental
and numerical uniaxial compressive and tensile stress–strain curves, respectively. It
indicates that: (i) the predicted compressive stress–strain curve by the default parameters is in good agreement with the experimental curve in the pre-peak stage, while
the post-peak stage has large deviations. The corresponding numerically derived
10 Residual Axial Capacity of UHPCC-FST Column Under …
300
300
100
100
100
100
200
50
50
(a)
(b)
Fig. 10.16 a FE models and b test specimens before and after axial tension, reprinted from Wang
et al. (2020a, b), copyright 2020, with permission from Elsevier
× 300 mm which is identical with that in the test, and the average mesh size of
the specimen is 7.7 mm. There are two steel plates on the top and bottom of the
specimen, where the bottom plate is fixed and the top plate is moving downwards
with the displacement rate of 0.4 mm/s, the specimen is subjected to axial compressive
load. The contact behavior between the surfaces of the steel plate and the specimen is
described by keyword *CONTACT_AUTOMATIC_SURFACE_TO_SURFACE, in
which the static and dynamic friction coefficients are set as 0.3 and 0.2, respectively.
Besides, Fig. 10.16 further illustrates the FE model of the uniaxial tension specimen
of UHPCC, i.e., a dog bone specimen. The geometric dimensions of the model are
also kept identical with those of the test specimen. The initial lengths of the tensile
region in the experiment and numerical model are both 300 mm (Fig. 10.16b), and
the average mesh size in this region is 7.7 mm. The lower end of the specimen with
a length of 100 mm is fixed, and the upper end of the specimen with a length of
100 mm is moved upwards by applying an axial tension load with the displacement
rate of 0.4 mm/s.
The default and modified parameters of K&C model (*MAT_72R3) for the present
UHPCC are given in Table 10.4. Figure 10.17 shows the corresponding experimental
and numerical uniaxial compressive and tensile stress–strain curves, respectively. It
indicates that: (i) the predicted compressive stress–strain curve by the default parameters is in good agreement with the experimental curve in the pre-peak stage, while
the post-peak stage has large deviations. The corresponding numerically derived