

10.6 Numerical Simulation
339
tension, which further controls the damage pattern of material. In K&C model, the
post-peak behavior of material is normally governed by the accumulated effective
plastic strain, which can be illustrated as
λ =
ε
p
0
d ε
p
r f (1 + p/(r f f t )) b 1
for p ≥ 0
(10.2a)
λ =
ε
p
0
d ε
p
r f (1 + p/(r f f t )) b 2
for p < 0
(10.2b)
where λ is the damage factor, f t is the static tensile strength of material, d ε
p
=
( 2 / 3 )d ε
p
ij d ε
p
ij is the effective plastic strain increment, and d ε
p
ij is the plastic strain
increment tensor, b 1 is softening factor for compression, b 2 is the softening factor
for tension. r f is the dynamic increase factor (DIF), which is defined as the ratio of
dynamic-to-static strength under certain strain rate and commonly used to represent
the strength enhancement under high strain rate.
It can be seen from Eq. (10.2) that the damage factors have different expressions
under compression (p ≥ 0) and tension (p < 0), respectively. The softening factor b 1
in Eq. (10.2a) is determined by the descending branch in compressive stress–strain
curve, and the softening factor b 2 in Eq. (10.2b) controlled the fracture strain energy
of material under tensile softening. Hence, in current study, the tensile strength f t ,
the compressive and tensile softening factor b 1 and b 2 automatically generated in the
original K&C model will be modified in order to simulate the post-peak compressive
and tensile behaviors of UHPCC properly.
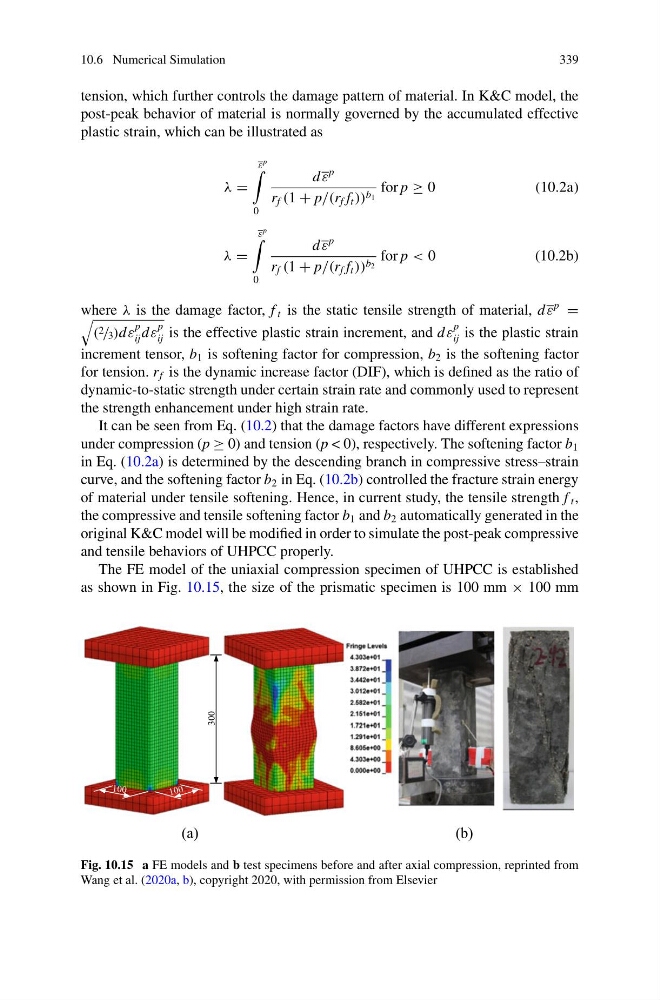
The FE model of the uniaxial compression specimen of UHPCC is established
as shown in Fig. 10.15, the size of the prismatic specimen is 100 mm × 100 mm
300
(a)
(b)
Fig. 10.15 a FE models and b test specimens before and after axial compression, reprinted from
Wang et al. (2020a, b), copyright 2020, with permission from Elsevier
339
tension, which further controls the damage pattern of material. In K&C model, the
post-peak behavior of material is normally governed by the accumulated effective
plastic strain, which can be illustrated as
λ =
ε
p
0
d ε
p
r f (1 + p/(r f f t )) b 1
for p ≥ 0
(10.2a)
λ =
ε
p
0
d ε
p
r f (1 + p/(r f f t )) b 2
for p < 0
(10.2b)
where λ is the damage factor, f t is the static tensile strength of material, d ε
p
=
( 2 / 3 )d ε
p
ij d ε
p
ij is the effective plastic strain increment, and d ε
p
ij is the plastic strain
increment tensor, b 1 is softening factor for compression, b 2 is the softening factor
for tension. r f is the dynamic increase factor (DIF), which is defined as the ratio of
dynamic-to-static strength under certain strain rate and commonly used to represent
the strength enhancement under high strain rate.
It can be seen from Eq. (10.2) that the damage factors have different expressions
under compression (p ≥ 0) and tension (p < 0), respectively. The softening factor b 1
in Eq. (10.2a) is determined by the descending branch in compressive stress–strain
curve, and the softening factor b 2 in Eq. (10.2b) controlled the fracture strain energy
of material under tensile softening. Hence, in current study, the tensile strength f t ,
the compressive and tensile softening factor b 1 and b 2 automatically generated in the
original K&C model will be modified in order to simulate the post-peak compressive
and tensile behaviors of UHPCC properly.
The FE model of the uniaxial compression specimen of UHPCC is established
as shown in Fig. 10.15, the size of the prismatic specimen is 100 mm × 100 mm
300
(a)
(b)
Fig. 10.15 a FE models and b test specimens before and after axial compression, reprinted from
Wang et al. (2020a, b), copyright 2020, with permission from Elsevier