

9.5 Further Validations
309
0.015 0.020 0.025 0.030 0.035 0.040 0.045
0
200
400
600
800
1000
1200
1400
Time (s)
Test data (Fan et al. 2019)
Numerical simulation
Impact force (kN)
0.015 0.020 0.025 0.030 0.035 0.040 0.045 0.050
0
200
400
600
800
1000
1200
1400
1600
Time (s)
Impact force (kN)
Test data (Fan et al. 2019)
Numerical simulation
0.015
0.020
0.025
0.030
0.035
0
10
20
30
40
50
60
Test data (Fan et al. 2019)
Numerical simulation
Deflection (mm)
Time (s)
(a)
(b)
(c)
0.02
0.03
0.04
0.05
0.06
0
40
80
120
160
200
Deflection (mm)
Time (s)
Test data (Fan et al. 2019)
Numerical simulation
(d)
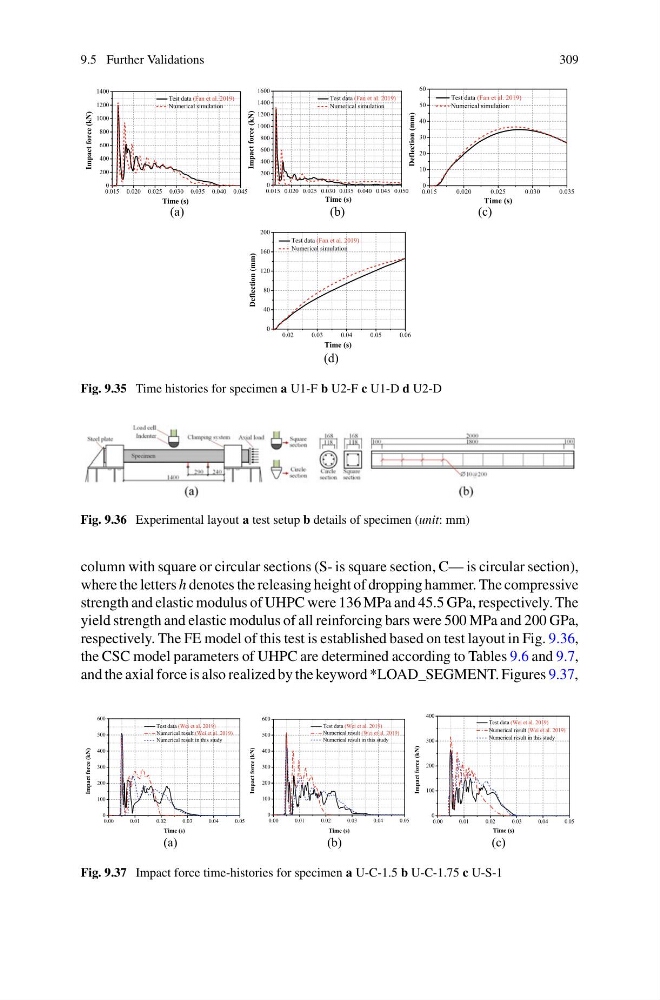
Fig. 9.35 Time histories for specimen a U1-F b U2-F c U1-D d U2-D
Fig. 9.36 Experimental layout a test setup b details of specimen (unit: mm)
column with square or circular sections (S- is square section, C— is circular section),
where the letters h denotes the releasing height of dropping hammer. The compressive
strength and elastic modulus of UHPC were 136 MPa and 45.5 GPa, respectively. The
yield strength and elastic modulus of all reinforcing bars were 500 MPa and 200 GPa,
respectively. The FE model of this test is established based on test layout in Fig. 9.36,
the CSC model parameters of UHPC are determined according to Tables 9.6 and 9.7,
and the axial force is also realized by the keyword *LOAD_SEGMENT. Figures 9.37,
0.00
0.01
0.02
0.03
0.04
0.05
0
100
200
300
400
500
600
Test data (Wei et al. 2019)
Numerical result (Wei et al. 2019)
Numerical result in this study
Time (s)
Impact force (kN)
0.00
0.01
0.02
0.03
0.04
0.05
0
100
200
300
400
500
600
Impact force (kN)
Time (s)
Test data (Wei et al. 2019)
Numerical result (Wei et al. 2019)
Numerical result in this study
0.00
0.01
0.02
0.03
0.04
0.05
0
100
200
300
400
Impact force (kN)
Time (s)
Test data (Wei et al. 2019)
Numerical result (Wei et al. 2019)
Numerical result in this study
(a)
(b)
(c)
Fig. 9.37 Impact force time-histories for specimen a U-C-1.5 b U-C-1.75 c U-S-1
309
0.015 0.020 0.025 0.030 0.035 0.040 0.045
0
200
400
600
800
1000
1200
1400
Time (s)
Test data (Fan et al. 2019)
Numerical simulation
Impact force (kN)
0.015 0.020 0.025 0.030 0.035 0.040 0.045 0.050
0
200
400
600
800
1000
1200
1400
1600
Time (s)
Impact force (kN)
Test data (Fan et al. 2019)
Numerical simulation
0.015
0.020
0.025
0.030
0.035
0
10
20
30
40
50
60
Test data (Fan et al. 2019)
Numerical simulation
Deflection (mm)
Time (s)
(a)
(b)
(c)
0.02
0.03
0.04
0.05
0.06
0
40
80
120
160
200
Deflection (mm)
Time (s)
Test data (Fan et al. 2019)
Numerical simulation
(d)
Fig. 9.35 Time histories for specimen a U1-F b U2-F c U1-D d U2-D
Fig. 9.36 Experimental layout a test setup b details of specimen (unit: mm)
column with square or circular sections (S- is square section, C— is circular section),
where the letters h denotes the releasing height of dropping hammer. The compressive
strength and elastic modulus of UHPC were 136 MPa and 45.5 GPa, respectively. The
yield strength and elastic modulus of all reinforcing bars were 500 MPa and 200 GPa,
respectively. The FE model of this test is established based on test layout in Fig. 9.36,
the CSC model parameters of UHPC are determined according to Tables 9.6 and 9.7,
and the axial force is also realized by the keyword *LOAD_SEGMENT. Figures 9.37,
0.00
0.01
0.02
0.03
0.04
0.05
0
100
200
300
400
500
600
Test data (Wei et al. 2019)
Numerical result (Wei et al. 2019)
Numerical result in this study
Time (s)
Impact force (kN)
0.00
0.01
0.02
0.03
0.04
0.05
0
100
200
300
400
500
600
Impact force (kN)
Time (s)
Test data (Wei et al. 2019)
Numerical result (Wei et al. 2019)
Numerical result in this study
0.00
0.01
0.02
0.03
0.04
0.05
0
100
200
300
400
Impact force (kN)
Time (s)
Test data (Wei et al. 2019)
Numerical result (Wei et al. 2019)
Numerical result in this study
(a)
(b)
(c)
Fig. 9.37 Impact force time-histories for specimen a U-C-1.5 b U-C-1.75 c U-S-1