

9.5 Further Validations
307
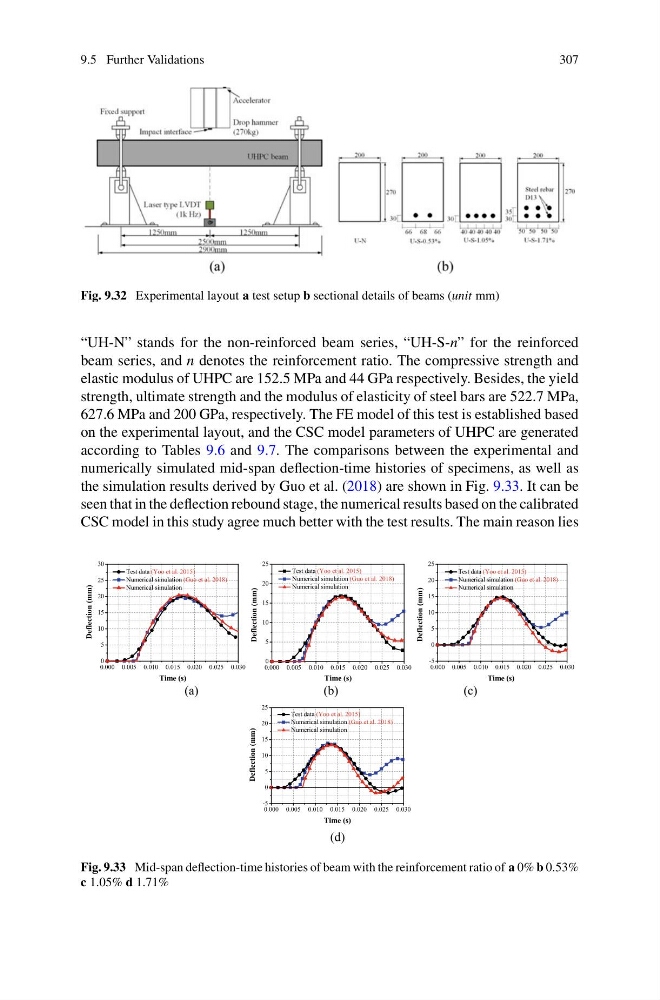
Fig. 9.32 Experimental layout a test setup b sectional details of beams (unit mm)
“UH-N” stands for the non-reinforced beam series, “UH-S-n” for the reinforced
beam series, and n denotes the reinforcement ratio. The compressive strength and
elastic modulus of UHPC are 152.5 MPa and 44 GPa respectively. Besides, the yield
strength, ultimate strength and the modulus of elasticity of steel bars are 522.7 MPa,
627.6 MPa and 200 GPa, respectively. The FE model of this test is established based
on the experimental layout, and the CSC model parameters of UHPC are generated
according to Tables 9.6 and 9.7. The comparisons between the experimental and
numerically simulated mid-span deflection-time histories of specimens, as well as
the simulation results derived by Guo et al. (2018) are shown in Fig. 9.33. It can be
seen that in the deflection rebound stage, the numerical results based on the calibrated
CSC model in this study agree much better with the test results. The main reason lies
0.000 0.005 0.010 0.015 0.020 0.025 0.030
0
5
10
15
20
25
30
Deflection (mm)
Time (s)
Test data (Yoo et al. 2015)
Numerical simulation (Guo et al. 2018)
Numerical simulation
0.000 0.005 0.010 0.015 0.020 0.025 0.030
0
5
10
15
20
25
Deflection (mm)
Time (s)
Test data (Yoo et al. 2015)
Numerical simulation (Guo et al. 2018)
Numerical simulation
0.000 0.005 0.010 0.015 0.020 0.025 0.030
-5
0
5
10
15
20
25
Deflection (mm)
Time (s)
Test data (Yoo et al. 2015)
Numerical simulation (Guo et al. 2018)
Numerical simulation
(a)
(b)
(c)
0.000 0.005 0.010 0.015 0.020 0.025 0.030
-5
0
5
10
15
20
25
Deflection (mm)
Time (s)
Test data (Yoo et al. 2015)
Numerical simulation (Guo et al. 2018)
Numerical simulation
(d)
Fig. 9.33 Mid-span deflection-time histories of beam with the reinforcement ratio of a 0% b 0.53%
c 1.05% d 1.71%
307
Fig. 9.32 Experimental layout a test setup b sectional details of beams (unit mm)
“UH-N” stands for the non-reinforced beam series, “UH-S-n” for the reinforced
beam series, and n denotes the reinforcement ratio. The compressive strength and
elastic modulus of UHPC are 152.5 MPa and 44 GPa respectively. Besides, the yield
strength, ultimate strength and the modulus of elasticity of steel bars are 522.7 MPa,
627.6 MPa and 200 GPa, respectively. The FE model of this test is established based
on the experimental layout, and the CSC model parameters of UHPC are generated
according to Tables 9.6 and 9.7. The comparisons between the experimental and
numerically simulated mid-span deflection-time histories of specimens, as well as
the simulation results derived by Guo et al. (2018) are shown in Fig. 9.33. It can be
seen that in the deflection rebound stage, the numerical results based on the calibrated
CSC model in this study agree much better with the test results. The main reason lies
0.000 0.005 0.010 0.015 0.020 0.025 0.030
0
5
10
15
20
25
30
Deflection (mm)
Time (s)
Test data (Yoo et al. 2015)
Numerical simulation (Guo et al. 2018)
Numerical simulation
0.000 0.005 0.010 0.015 0.020 0.025 0.030
0
5
10
15
20
25
Deflection (mm)
Time (s)
Test data (Yoo et al. 2015)
Numerical simulation (Guo et al. 2018)
Numerical simulation
0.000 0.005 0.010 0.015 0.020 0.025 0.030
-5
0
5
10
15
20
25
Deflection (mm)
Time (s)
Test data (Yoo et al. 2015)
Numerical simulation (Guo et al. 2018)
Numerical simulation
(a)
(b)
(c)
0.000 0.005 0.010 0.015 0.020 0.025 0.030
-5
0
5
10
15
20
25
Deflection (mm)
Time (s)
Test data (Yoo et al. 2015)
Numerical simulation (Guo et al. 2018)
Numerical simulation
(d)
Fig. 9.33 Mid-span deflection-time histories of beam with the reinforcement ratio of a 0% b 0.53%
c 1.05% d 1.71%