

306
9 Dynamic Responses of Reinforced UHPCC Members Under …
Table 9.9 Comparisons of experimental and numerical mid-span deflection
Drop height (m)
Max-deflection in test (mm)
Max-deflection in simulation
(mm)
Error (%)
0.8
14.1
14.5
2.8
1.0
14.5
18.6
28.2
1.2
24.7
23.6
−4.5
1.4
29.4
28.7
−2.4
1.6
36.1
34.2
−5.3
0.000
0.005
0.010
0.015
0.020
0.025
0
50
100
150
200
250
300
350
Impact force (kN)
Time (s)
Test data (Fujikake et al. 2006)
Numerical simulation
0.000
0.005
0.010
0.015
0.020
0.025
0
50
100
150
200
250
300
350
Test data (Fujikake et al. 2006)
Numerical simulation
Impact force (kN)
Time (s)
0.000
0.005
0.010
0.015
0.020
0.025
0
100
200
300
400
Test data (Fujikake et al. 2006)
Numerical simulation
Impact force (kN)
Time (s)
(a)
(b)
(c)
0.000
0.005
0.010
0.015
0.020
0.025
0
100
200
300
400
Test data (Fujikake et al. 2006)
Numerical simulation
Impact force (kN)
Time (s)
0.000
0.005
0.010
0.015
0.020
0.025
0
100
200
300
400
500
Test data (Fujikake et al. 2006)
Numerical simulation
Impact force (kN)
Time (s)
(d)
(e)
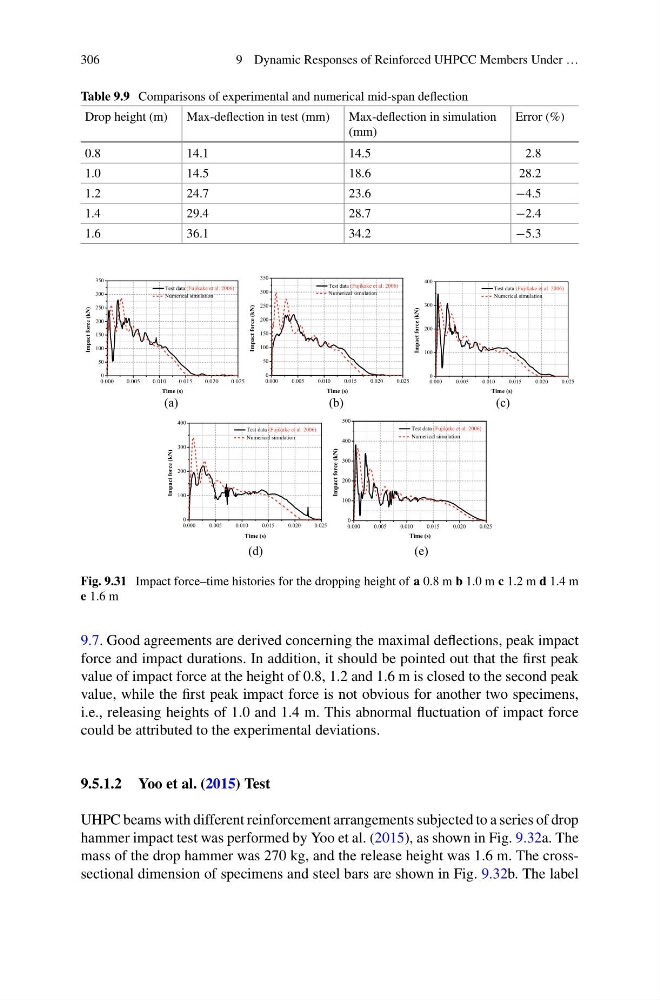
Fig. 9.31 Impact force–time histories for the dropping height of a 0.8 m b 1.0 m c 1.2 m d 1.4 m
e 1.6 m
9.7. Good agreements are derived concerning the maximal deflections, peak impact
force and impact durations. In addition, it should be pointed out that the first peak
value of impact force at the height of 0.8, 1.2 and 1.6 m is closed to the second peak
value, while the first peak impact force is not obvious for another two specimens,
i.e., releasing heights of 1.0 and 1.4 m. This abnormal fluctuation of impact force
could be attributed to the experimental deviations.
9.5.1.2 Yoo et al. (2015) Test
UHPC beams with different reinforcement arrangements subjected to a series of drop
hammer impact test was performed by Yoo et al. (2015), as shown in Fig. 9.32a. The
mass of the drop hammer was 270 kg, and the release height was 1.6 m. The crosssectional dimension of specimens and steel bars are shown in Fig. 9.32b. The label
9 Dynamic Responses of Reinforced UHPCC Members Under …
Table 9.9 Comparisons of experimental and numerical mid-span deflection
Drop height (m)
Max-deflection in test (mm)
Max-deflection in simulation
(mm)
Error (%)
0.8
14.1
14.5
2.8
1.0
14.5
18.6
28.2
1.2
24.7
23.6
−4.5
1.4
29.4
28.7
−2.4
1.6
36.1
34.2
−5.3
0.000
0.005
0.010
0.015
0.020
0.025
0
50
100
150
200
250
300
350
Impact force (kN)
Time (s)
Test data (Fujikake et al. 2006)
Numerical simulation
0.000
0.005
0.010
0.015
0.020
0.025
0
50
100
150
200
250
300
350
Test data (Fujikake et al. 2006)
Numerical simulation
Impact force (kN)
Time (s)
0.000
0.005
0.010
0.015
0.020
0.025
0
100
200
300
400
Test data (Fujikake et al. 2006)
Numerical simulation
Impact force (kN)
Time (s)
(a)
(b)
(c)
0.000
0.005
0.010
0.015
0.020
0.025
0
100
200
300
400
Test data (Fujikake et al. 2006)
Numerical simulation
Impact force (kN)
Time (s)
0.000
0.005
0.010
0.015
0.020
0.025
0
100
200
300
400
500
Test data (Fujikake et al. 2006)
Numerical simulation
Impact force (kN)
Time (s)
(d)
(e)
Fig. 9.31 Impact force–time histories for the dropping height of a 0.8 m b 1.0 m c 1.2 m d 1.4 m
e 1.6 m
9.7. Good agreements are derived concerning the maximal deflections, peak impact
force and impact durations. In addition, it should be pointed out that the first peak
value of impact force at the height of 0.8, 1.2 and 1.6 m is closed to the second peak
value, while the first peak impact force is not obvious for another two specimens,
i.e., releasing heights of 1.0 and 1.4 m. This abnormal fluctuation of impact force
could be attributed to the experimental deviations.
9.5.1.2 Yoo et al. (2015) Test
UHPC beams with different reinforcement arrangements subjected to a series of drop
hammer impact test was performed by Yoo et al. (2015), as shown in Fig. 9.32a. The
mass of the drop hammer was 270 kg, and the release height was 1.6 m. The crosssectional dimension of specimens and steel bars are shown in Fig. 9.32b. The label