

9.4 Numerical Simulation
295
where σ
vp
ij and σ
d
ij are the stress tensors without and with damage; τ b and τ d are the
brittle damage threshold and ductile damage threshold, r 0b and r 0d are the corresponding initial threshold. In addition, the brittle fracture energy G
B
f and ductile
fracture energy G
D
f are adopted to dominate the damage, which can be expressed as
G
B
f = GFS + trans B (GFT − GFS)
(9.18a)
G
D
f = GFS + trans D (GFC − GFS)
(9.18b)
trans B =
−I 1 /
3J 2
pwrt , trans D =
I 1 /
3J 2
pwrc
(9.18c)
where parameters GFC, GFT and GFS are the fracture energy under uniaxial
compression, uniaxial tension and pure shear, respectively. The parameters pwrt
and pwrc are the transition parameter for shear-to-compression and shear-to-tension,
respectively. To make that transition smooth, the default values 5.0 and 1.0 are
adopted for the parameters pwrt and pwrc (Murray 2007). The fracture energy parameters (GFC, GFT and GFS) are related to the critical length of the element l e in the
simulation, as given in Eq. (9.19). Considering that the 10 mm mesh size is determined by the mesh convergency analyses in the following numerical simulations,
the critical length of element is adopted as 10 mm at present.
σ d ε = G f /l e
(9.19)
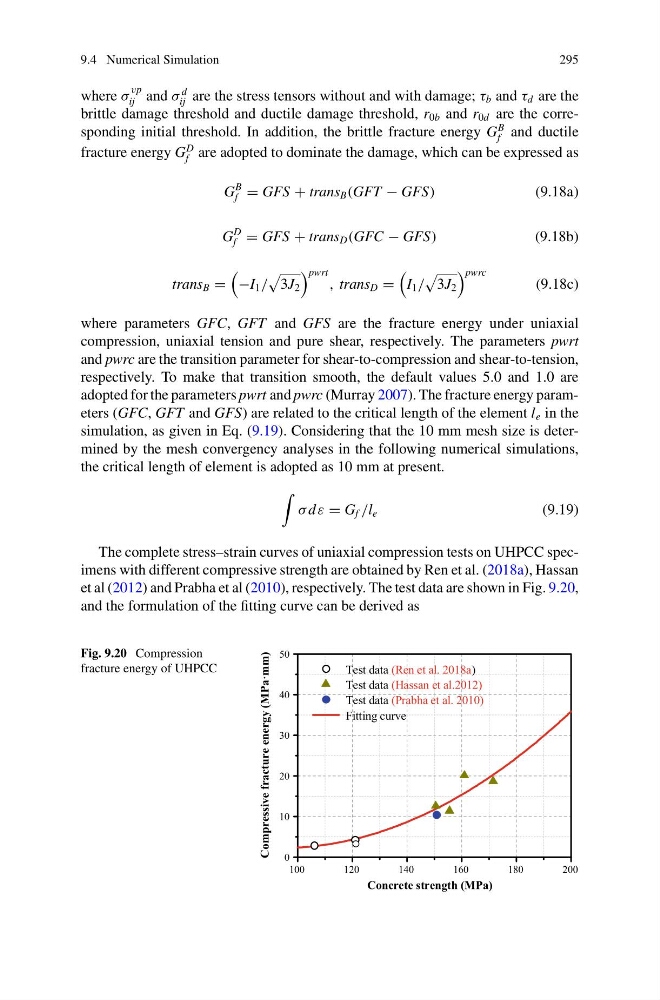
The complete stress–strain curves of uniaxial compression tests on UHPCC specimens with different compressive strength are obtained by Ren et al. (2018a), Hassan
et al (2012) and Prabha et al (2010), respectively. The test data are shown in Fig. 9.20,
and the formulation of the fitting curve can be derived as
Fig. 9.20 Compression
fracture energy of UHPCC
100
120
140
160
180
200
0
10
20
30
40
50
Test data (Ren et al. 2018a)
Test data (Hassan et al.2012)
Test data (Prabha et al. 2010)
Fitting curve
Compressive fracture energy (MPa·mm)
Concrete strength (MPa)
295
where σ
vp
ij and σ
d
ij are the stress tensors without and with damage; τ b and τ d are the
brittle damage threshold and ductile damage threshold, r 0b and r 0d are the corresponding initial threshold. In addition, the brittle fracture energy G
B
f and ductile
fracture energy G
D
f are adopted to dominate the damage, which can be expressed as
G
B
f = GFS + trans B (GFT − GFS)
(9.18a)
G
D
f = GFS + trans D (GFC − GFS)
(9.18b)
trans B =
−I 1 /
3J 2
pwrt , trans D =
I 1 /
3J 2
pwrc
(9.18c)
where parameters GFC, GFT and GFS are the fracture energy under uniaxial
compression, uniaxial tension and pure shear, respectively. The parameters pwrt
and pwrc are the transition parameter for shear-to-compression and shear-to-tension,
respectively. To make that transition smooth, the default values 5.0 and 1.0 are
adopted for the parameters pwrt and pwrc (Murray 2007). The fracture energy parameters (GFC, GFT and GFS) are related to the critical length of the element l e in the
simulation, as given in Eq. (9.19). Considering that the 10 mm mesh size is determined by the mesh convergency analyses in the following numerical simulations,
the critical length of element is adopted as 10 mm at present.
σ d ε = G f /l e
(9.19)
The complete stress–strain curves of uniaxial compression tests on UHPCC specimens with different compressive strength are obtained by Ren et al. (2018a), Hassan
et al (2012) and Prabha et al (2010), respectively. The test data are shown in Fig. 9.20,
and the formulation of the fitting curve can be derived as
Fig. 9.20 Compression
fracture energy of UHPCC
100
120
140
160
180
200
0
10
20
30
40
50
Test data (Ren et al. 2018a)
Test data (Hassan et al.2012)
Test data (Prabha et al. 2010)
Fitting curve
Compressive fracture energy (MPa·mm)
Concrete strength (MPa)