

9.3 Test Results and Discussions
287
0
10
20
30
40
50
60
0.1
0.07
0.05
0.01
0
Max. deflection
Res. deflection
Mid-span deflection (mm)
Axial load level
Ratio of max. /
res.
0
1
2
3
4
5
6
Ratio of max. / res.
0
10
20
30
40
50
60
0.1
0.05
0
Mid-span deflection (mm)
Axial load level
Max. deflection
Res. deflection
0
1
2
3
4
5
6
Ratio of max. / res.
Ratio of
max. / res.
(a)
(b)
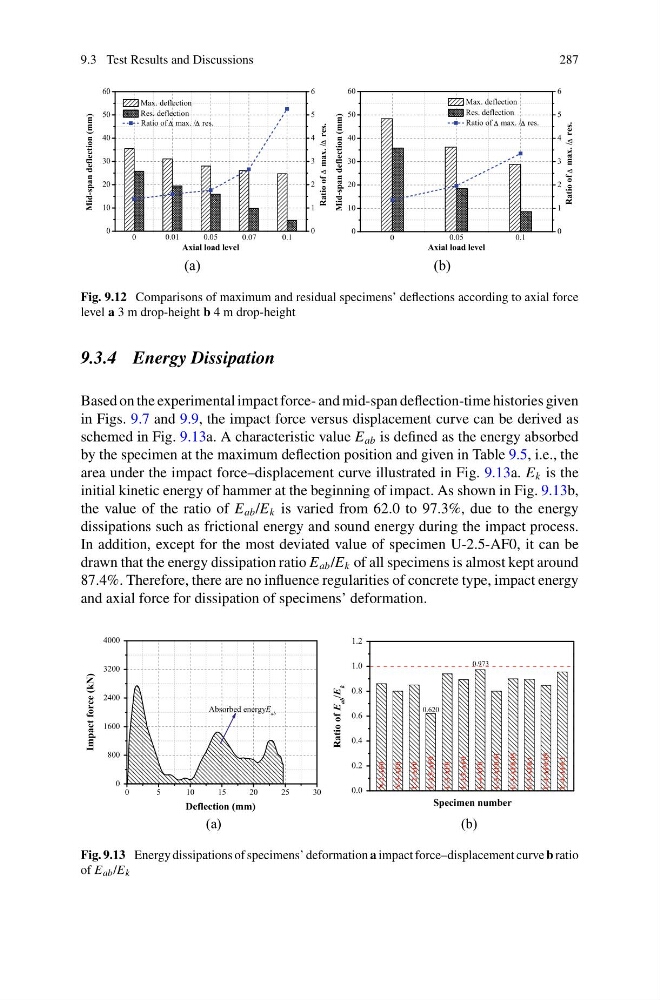
Fig. 9.12 Comparisons of maximum and residual specimens’ deflections according to axial force
level a 3 m drop-height b 4 m drop-height
9.3.4 Energy Dissipation
Based on the experimental impact force- and mid-span deflection-time histories given
in Figs. 9.7 and 9.9, the impact force versus displacement curve can be derived as
schemed in Fig. 9.13a. A characteristic value E ab is defined as the energy absorbed
by the specimen at the maximum deflection position and given in Table 9.5, i.e., the
area under the impact force–displacement curve illustrated in Fig. 9.13a. E k is the
initial kinetic energy of hammer at the beginning of impact. As shown in Fig. 9.13b,
the value of the ratio of E ab /E k is varied from 62.0 to 97.3%, due to the energy
dissipations such as frictional energy and sound energy during the impact process.
In addition, except for the most deviated value of specimen U-2.5-AF0, it can be
drawn that the energy dissipation ratio E ab /E k of all specimens is almost kept around
87.4%. Therefore, there are no influence regularities of concrete type, impact energy
and axial force for dissipation of specimens’ deformation.
0
5
10
15
20
25
30
0
800
1600
2400
3200
4000
Absorbed energy E ab
Deflection (mm)
Impact force (kN)
0.0
0.2
0.4
0.6
0.8
1.0
1.2
0.620
0.973
Ratio of E
ab
/E
k
Specimen number
U-4-AF0.1
U-4-AF0.05
U-3-AF0.1
U-3-AF0.05
U-3-AF0.01
U-4-AF0
U-3.5-AF0
U-3-AF0
U-2.5-AF0
U-2-AF0
N-3-AF0
N-2-AF0
(a)
(b)
Fig. 9.13 Energy dissipations of specimens’ deformation a impact force–displacement curve b ratio
of E ab /E k
287
0
10
20
30
40
50
60
0.1
0.07
0.05
0.01
0
Max. deflection
Res. deflection
Mid-span deflection (mm)
Axial load level
Ratio of max. /
res.
0
1
2
3
4
5
6
Ratio of max. / res.
0
10
20
30
40
50
60
0.1
0.05
0
Mid-span deflection (mm)
Axial load level
Max. deflection
Res. deflection
0
1
2
3
4
5
6
Ratio of max. / res.
Ratio of
max. / res.
(a)
(b)
Fig. 9.12 Comparisons of maximum and residual specimens’ deflections according to axial force
level a 3 m drop-height b 4 m drop-height
9.3.4 Energy Dissipation
Based on the experimental impact force- and mid-span deflection-time histories given
in Figs. 9.7 and 9.9, the impact force versus displacement curve can be derived as
schemed in Fig. 9.13a. A characteristic value E ab is defined as the energy absorbed
by the specimen at the maximum deflection position and given in Table 9.5, i.e., the
area under the impact force–displacement curve illustrated in Fig. 9.13a. E k is the
initial kinetic energy of hammer at the beginning of impact. As shown in Fig. 9.13b,
the value of the ratio of E ab /E k is varied from 62.0 to 97.3%, due to the energy
dissipations such as frictional energy and sound energy during the impact process.
In addition, except for the most deviated value of specimen U-2.5-AF0, it can be
drawn that the energy dissipation ratio E ab /E k of all specimens is almost kept around
87.4%. Therefore, there are no influence regularities of concrete type, impact energy
and axial force for dissipation of specimens’ deformation.
0
5
10
15
20
25
30
0
800
1600
2400
3200
4000
Absorbed energy E ab
Deflection (mm)
Impact force (kN)
0.0
0.2
0.4
0.6
0.8
1.0
1.2
0.620
0.973
Ratio of E
ab
/E
k
Specimen number
U-4-AF0.1
U-4-AF0.05
U-3-AF0.1
U-3-AF0.05
U-3-AF0.01
U-4-AF0
U-3.5-AF0
U-3-AF0
U-2.5-AF0
U-2-AF0
N-3-AF0
N-2-AF0
(a)
(b)
Fig. 9.13 Energy dissipations of specimens’ deformation a impact force–displacement curve b ratio
of E ab /E k