

9.2 Test Program
277
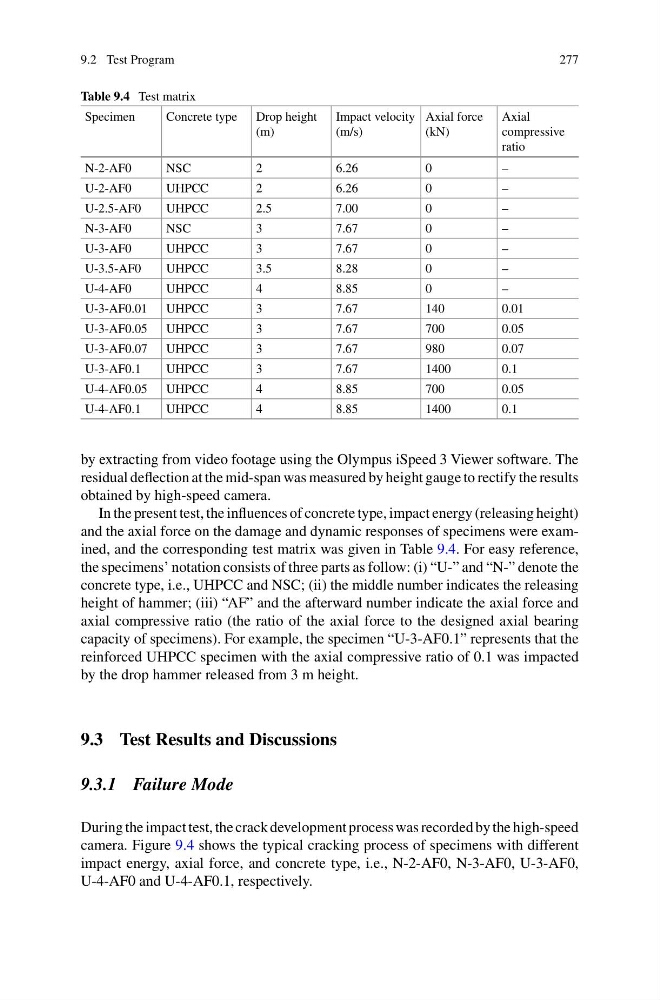
Table 9.4 Test matrix
Specimen
Concrete type Drop height
(m)
Impact velocity
(m/s)
Axial force
(kN)
Axial
compressive
ratio
N-2-AF0
NSC
2
6.26
0
–
U-2-AF0
UHPCC
2
6.26
0
–
U-2.5-AF0
UHPCC
2.5
7.00
0
–
N-3-AF0
NSC
3
7.67
0
–
U-3-AF0
UHPCC
3
7.67
0
–
U-3.5-AF0
UHPCC
3.5
8.28
0
–
U-4-AF0
UHPCC
4
8.85
0
–
U-3-AF0.01 UHPCC
3
7.67
140
0.01
U-3-AF0.05 UHPCC
3
7.67
700
0.05
U-3-AF0.07 UHPCC
3
7.67
980
0.07
U-3-AF0.1
UHPCC
3
7.67
1400
0.1
U-4-AF0.05 UHPCC
4
8.85
700
0.05
U-4-AF0.1
UHPCC
4
8.85
1400
0.1
by extracting from video footage using the Olympus iSpeed 3 Viewer software. The
residual deflection at the mid-span was measured by height gauge to rectify the results
obtained by high-speed camera.
In the present test, the influences of concrete type, impact energy (releasing height)
and the axial force on the damage and dynamic responses of specimens were examined, and the corresponding test matrix was given in Table 9.4. For easy reference,
the specimens’ notation consists of three parts as follow: (i) “U-” and “N-” denote the
concrete type, i.e., UHPCC and NSC; (ii) the middle number indicates the releasing
height of hammer; (iii) “AF” and the afterward number indicate the axial force and
axial compressive ratio (the ratio of the axial force to the designed axial bearing
capacity of specimens). For example, the specimen “U-3-AF0.1” represents that the
reinforced UHPCC specimen with the axial compressive ratio of 0.1 was impacted
by the drop hammer released from 3 m height.
9.3 Test Results and Discussions
9.3.1 Failure Mode
During the impact test, the crack development process was recorded by the high-speed
camera. Figure 9.4 shows the typical cracking process of specimens with different
impact energy, axial force, and concrete type, i.e., N-2-AF0, N-3-AF0, U-3-AF0,
U-4-AF0 and U-4-AF0.1, respectively.
277
Table 9.4 Test matrix
Specimen
Concrete type Drop height
(m)
Impact velocity
(m/s)
Axial force
(kN)
Axial
compressive
ratio
N-2-AF0
NSC
2
6.26
0
–
U-2-AF0
UHPCC
2
6.26
0
–
U-2.5-AF0
UHPCC
2.5
7.00
0
–
N-3-AF0
NSC
3
7.67
0
–
U-3-AF0
UHPCC
3
7.67
0
–
U-3.5-AF0
UHPCC
3.5
8.28
0
–
U-4-AF0
UHPCC
4
8.85
0
–
U-3-AF0.01 UHPCC
3
7.67
140
0.01
U-3-AF0.05 UHPCC
3
7.67
700
0.05
U-3-AF0.07 UHPCC
3
7.67
980
0.07
U-3-AF0.1
UHPCC
3
7.67
1400
0.1
U-4-AF0.05 UHPCC
4
8.85
700
0.05
U-4-AF0.1
UHPCC
4
8.85
1400
0.1
by extracting from video footage using the Olympus iSpeed 3 Viewer software. The
residual deflection at the mid-span was measured by height gauge to rectify the results
obtained by high-speed camera.
In the present test, the influences of concrete type, impact energy (releasing height)
and the axial force on the damage and dynamic responses of specimens were examined, and the corresponding test matrix was given in Table 9.4. For easy reference,
the specimens’ notation consists of three parts as follow: (i) “U-” and “N-” denote the
concrete type, i.e., UHPCC and NSC; (ii) the middle number indicates the releasing
height of hammer; (iii) “AF” and the afterward number indicate the axial force and
axial compressive ratio (the ratio of the axial force to the designed axial bearing
capacity of specimens). For example, the specimen “U-3-AF0.1” represents that the
reinforced UHPCC specimen with the axial compressive ratio of 0.1 was impacted
by the drop hammer released from 3 m height.
9.3 Test Results and Discussions
9.3.1 Failure Mode
During the impact test, the crack development process was recorded by the high-speed
camera. Figure 9.4 shows the typical cracking process of specimens with different
impact energy, axial force, and concrete type, i.e., N-2-AF0, N-3-AF0, U-3-AF0,
U-4-AF0 and U-4-AF0.1, respectively.