

276
9 Dynamic Responses of Reinforced UHPCC Members Under …
0.00
0.02
0.04
0.06
0.08
0.10
0
400
800
1200
1600
2000
U-3-AF0.1
U-3-AF0.07
U-3-AF0.05
U-3-AF0.01
1400kN
980kN
700kN
140kN
Axial load (kN)
Time (s)
0.00
0.02
0.04
0.06
0.08
0.10
0
400
800
1200
1600
2000
U-4-AF0.1
U-4-AF0.05
1400kN
700kN
Axial load (kN)
Time (s)
(a)
(b)
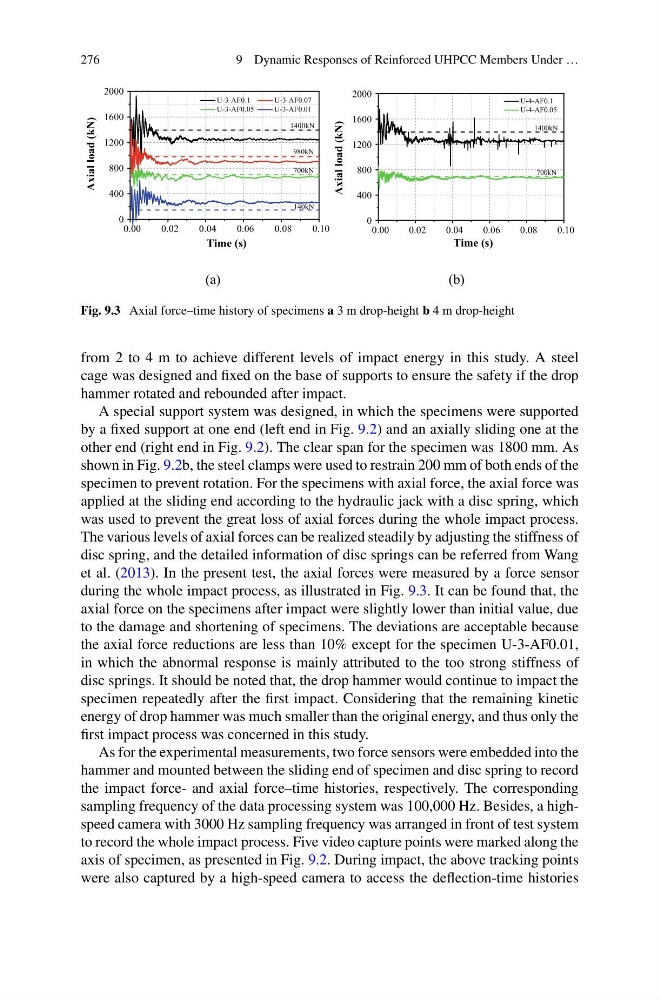
Fig. 9.3 Axial force–time history of specimens a 3 m drop-height b 4 m drop-height
from 2 to 4 m to achieve different levels of impact energy in this study. A steel
cage was designed and fixed on the base of supports to ensure the safety if the drop
hammer rotated and rebounded after impact.
A special support system was designed, in which the specimens were supported
by a fixed support at one end (left end in Fig. 9.2) and an axially sliding one at the
other end (right end in Fig. 9.2). The clear span for the specimen was 1800 mm. As
shown in Fig. 9.2b, the steel clamps were used to restrain 200 mm of both ends of the
specimen to prevent rotation. For the specimens with axial force, the axial force was
applied at the sliding end according to the hydraulic jack with a disc spring, which
was used to prevent the great loss of axial forces during the whole impact process.
The various levels of axial forces can be realized steadily by adjusting the stiffness of
disc spring, and the detailed information of disc springs can be referred from Wang
et al. (2013). In the present test, the axial forces were measured by a force sensor
during the whole impact process, as illustrated in Fig. 9.3. It can be found that, the
axial force on the specimens after impact were slightly lower than initial value, due
to the damage and shortening of specimens. The deviations are acceptable because
the axial force reductions are less than 10% except for the specimen U-3-AF0.01,
in which the abnormal response is mainly attributed to the too strong stiffness of
disc springs. It should be noted that, the drop hammer would continue to impact the
specimen repeatedly after the first impact. Considering that the remaining kinetic
energy of drop hammer was much smaller than the original energy, and thus only the
first impact process was concerned in this study.
As for the experimental measurements, two force sensors were embedded into the
hammer and mounted between the sliding end of specimen and disc spring to record
the impact force- and axial force–time histories, respectively. The corresponding
sampling frequency of the data processing system was 100,000 Hz. Besides, a highspeed camera with 3000 Hz sampling frequency was arranged in front of test system
to record the whole impact process. Five video capture points were marked along the
axis of specimen, as presented in Fig. 9.2. During impact, the above tracking points
were also captured by a high-speed camera to access the deflection-time histories
9 Dynamic Responses of Reinforced UHPCC Members Under …
0.00
0.02
0.04
0.06
0.08
0.10
0
400
800
1200
1600
2000
U-3-AF0.1
U-3-AF0.07
U-3-AF0.05
U-3-AF0.01
1400kN
980kN
700kN
140kN
Axial load (kN)
Time (s)
0.00
0.02
0.04
0.06
0.08
0.10
0
400
800
1200
1600
2000
U-4-AF0.1
U-4-AF0.05
1400kN
700kN
Axial load (kN)
Time (s)
(a)
(b)
Fig. 9.3 Axial force–time history of specimens a 3 m drop-height b 4 m drop-height
from 2 to 4 m to achieve different levels of impact energy in this study. A steel
cage was designed and fixed on the base of supports to ensure the safety if the drop
hammer rotated and rebounded after impact.
A special support system was designed, in which the specimens were supported
by a fixed support at one end (left end in Fig. 9.2) and an axially sliding one at the
other end (right end in Fig. 9.2). The clear span for the specimen was 1800 mm. As
shown in Fig. 9.2b, the steel clamps were used to restrain 200 mm of both ends of the
specimen to prevent rotation. For the specimens with axial force, the axial force was
applied at the sliding end according to the hydraulic jack with a disc spring, which
was used to prevent the great loss of axial forces during the whole impact process.
The various levels of axial forces can be realized steadily by adjusting the stiffness of
disc spring, and the detailed information of disc springs can be referred from Wang
et al. (2013). In the present test, the axial forces were measured by a force sensor
during the whole impact process, as illustrated in Fig. 9.3. It can be found that, the
axial force on the specimens after impact were slightly lower than initial value, due
to the damage and shortening of specimens. The deviations are acceptable because
the axial force reductions are less than 10% except for the specimen U-3-AF0.01,
in which the abnormal response is mainly attributed to the too strong stiffness of
disc springs. It should be noted that, the drop hammer would continue to impact the
specimen repeatedly after the first impact. Considering that the remaining kinetic
energy of drop hammer was much smaller than the original energy, and thus only the
first impact process was concerned in this study.
As for the experimental measurements, two force sensors were embedded into the
hammer and mounted between the sliding end of specimen and disc spring to record
the impact force- and axial force–time histories, respectively. The corresponding
sampling frequency of the data processing system was 100,000 Hz. Besides, a highspeed camera with 3000 Hz sampling frequency was arranged in front of test system
to record the whole impact process. Five video capture points were marked along the
axis of specimen, as presented in Fig. 9.2. During impact, the above tracking points
were also captured by a high-speed camera to access the deflection-time histories