

244
8 Response of UHPCC-FST Subjected to Low-Velocity Impact
Fig. 8.6 Specific locations of measurement points (unit: mm), reprinted from Wu et al. (2019),
copyright 2020, with permission from Elsevier
for measuring the deflections of the specimens, the corresponding specific locations
of measurement points are illustrated in Fig. 8.6.
8.3 Test Results and Discussions
8.3.1 Axial Compression
8.3.1.1 Axial Load Bearing Capacity
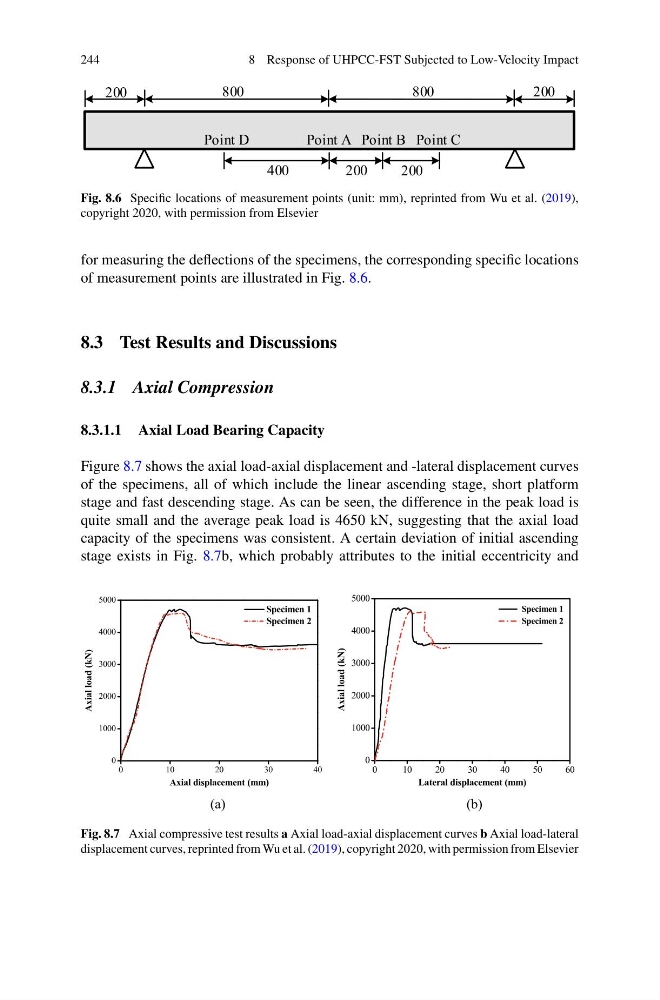
Figure 8.7 shows the axial load-axial displacement and -lateral displacement curves
of the specimens, all of which include the linear ascending stage, short platform
stage and fast descending stage. As can be seen, the difference in the peak load is
quite small and the average peak load is 4650 kN, suggesting that the axial load
capacity of the specimens was consistent. A certain deviation of initial ascending
stage exists in Fig. 8.7b, which probably attributes to the initial eccentricity and
Fig. 8.7 Axial compressive test results a Axial load-axial displacement curves b Axial load-lateral
displacement curves, reprinted from Wu et al. (2019), copyright 2020, with permission from Elsevier
8 Response of UHPCC-FST Subjected to Low-Velocity Impact
Fig. 8.6 Specific locations of measurement points (unit: mm), reprinted from Wu et al. (2019),
copyright 2020, with permission from Elsevier
for measuring the deflections of the specimens, the corresponding specific locations
of measurement points are illustrated in Fig. 8.6.
8.3 Test Results and Discussions
8.3.1 Axial Compression
8.3.1.1 Axial Load Bearing Capacity
Figure 8.7 shows the axial load-axial displacement and -lateral displacement curves
of the specimens, all of which include the linear ascending stage, short platform
stage and fast descending stage. As can be seen, the difference in the peak load is
quite small and the average peak load is 4650 kN, suggesting that the axial load
capacity of the specimens was consistent. A certain deviation of initial ascending
stage exists in Fig. 8.7b, which probably attributes to the initial eccentricity and
Fig. 8.7 Axial compressive test results a Axial load-axial displacement curves b Axial load-lateral
displacement curves, reprinted from Wu et al. (2019), copyright 2020, with permission from Elsevier