

7.2 Impact Test on 10CrNi3MoV21A Armor Steel/SiC Ceramic/UHPCC …
215
Table 7.11 Deviations of the experimental and numerically simulated results of P and L r
Target
P(mm)
L r (mm)
Test
Simulation Deviation (%) Test
Simulation Deviation (%)
N
287.5
287
–
–
–
–
U
180.5
180
–
178.5
180
0.84
S5
166.5
165
–
177
180
1.69
C6
143.5
139.4
−2.86
165
150.5
−8.79
S10
118.5
123
3.80
161.5
156.2
−3.28
C11
65
78.6
20.92
136
139.9
2.87
S5/C6 120.5
124.9
3.65
168
155.8
−7.26
(Liu et al. 2018). Then, the increase of internal energies of the projectile and target is
another important aspect of the energy transformation. Lastly, the rest of the initial
kinetic energy can also be consumed by the friction between the projectile and target.
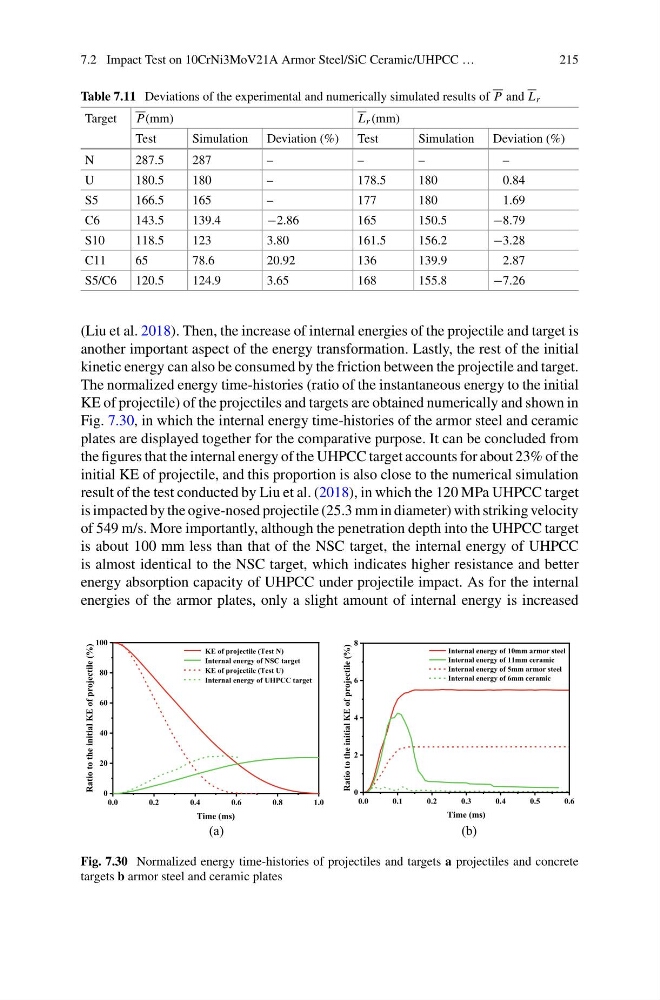
The normalized energy time-histories (ratio of the instantaneous energy to the initial
KE of projectile) of the projectiles and targets are obtained numerically and shown in
Fig. 7.30, in which the internal energy time-histories of the armor steel and ceramic
plates are displayed together for the comparative purpose. It can be concluded from
the figures that the internal energy of the UHPCC target accounts for about 23% of the
initial KE of projectile, and this proportion is also close to the numerical simulation
result of the test conducted by Liu et al. (2018), in which the 120 MPa UHPCC target
is impacted by the ogive-nosed projectile (25.3 mm in diameter) with striking velocity
of 549 m/s. More importantly, although the penetration depth into the UHPCC target
is about 100 mm less than that of the NSC target, the internal energy of UHPCC
is almost identical to the NSC target, which indicates higher resistance and better
energy absorption capacity of UHPCC under projectile impact. As for the internal
energies of the armor plates, only a slight amount of internal energy is increased
0.0
0.2
0.4
0.6
0.8
1.0
0
20
40
60
80
100
KE of projectile (Test N)
Internal energy of NSC target
KE of projectile (Test U)
Internal energy of UHPCC target
Ratio to the initial KE of projectile (%)
Time (ms)
0.0
0.1
0.2
0.3
0.4
0.5
0.6
0
2
4
6
8
Internal energy of 10mm armor steel
Internal energy of 11mm ceramic
Internal energy of 5mm armor steel
Internal energy of 6mm ceramic
Ratio to the initial KE of projectile (%)
Time (ms)
(a)
(b)
Fig. 7.30 Normalized energy time-histories of projectiles and targets a projectiles and concrete
targets b armor steel and ceramic plates
215
Table 7.11 Deviations of the experimental and numerically simulated results of P and L r
Target
P(mm)
L r (mm)
Test
Simulation Deviation (%) Test
Simulation Deviation (%)
N
287.5
287
–
–
–
–
U
180.5
180
–
178.5
180
0.84
S5
166.5
165
–
177
180
1.69
C6
143.5
139.4
−2.86
165
150.5
−8.79
S10
118.5
123
3.80
161.5
156.2
−3.28
C11
65
78.6
20.92
136
139.9
2.87
S5/C6 120.5
124.9
3.65
168
155.8
−7.26
(Liu et al. 2018). Then, the increase of internal energies of the projectile and target is
another important aspect of the energy transformation. Lastly, the rest of the initial
kinetic energy can also be consumed by the friction between the projectile and target.
The normalized energy time-histories (ratio of the instantaneous energy to the initial
KE of projectile) of the projectiles and targets are obtained numerically and shown in
Fig. 7.30, in which the internal energy time-histories of the armor steel and ceramic
plates are displayed together for the comparative purpose. It can be concluded from
the figures that the internal energy of the UHPCC target accounts for about 23% of the
initial KE of projectile, and this proportion is also close to the numerical simulation
result of the test conducted by Liu et al. (2018), in which the 120 MPa UHPCC target
is impacted by the ogive-nosed projectile (25.3 mm in diameter) with striking velocity
of 549 m/s. More importantly, although the penetration depth into the UHPCC target
is about 100 mm less than that of the NSC target, the internal energy of UHPCC
is almost identical to the NSC target, which indicates higher resistance and better
energy absorption capacity of UHPCC under projectile impact. As for the internal
energies of the armor plates, only a slight amount of internal energy is increased
0.0
0.2
0.4
0.6
0.8
1.0
0
20
40
60
80
100
KE of projectile (Test N)
Internal energy of NSC target
KE of projectile (Test U)
Internal energy of UHPCC target
Ratio to the initial KE of projectile (%)
Time (ms)
0.0
0.1
0.2
0.3
0.4
0.5
0.6
0
2
4
6
8
Internal energy of 10mm armor steel
Internal energy of 11mm ceramic
Internal energy of 5mm armor steel
Internal energy of 6mm ceramic
Ratio to the initial KE of projectile (%)
Time (ms)
(a)
(b)
Fig. 7.30 Normalized energy time-histories of projectiles and targets a projectiles and concrete
targets b armor steel and ceramic plates