

7.2 Impact Test on 10CrNi3MoV21A Armor Steel/SiC Ceramic/UHPCC …
213
penetration depth. Firstly, as for rigid penetration scenarios of N, U and S5 tests,
the maximum principal strain for NSC and UHPCC and failure parameter D 1 for
10CrNi3MoV21A armor steel were determined as 0.22, 0.2 and 0.58, respectively. It
should be noted that, only D 1 in JC damage model was adopted at present following
the method proposed by Rosenberg and Dekel (2003), and all the failure parameters would be adopted in the remaining simulations once they were validated. Then,
the failure parameter D 1 = 0.8 in JC damage model for the ALE-algorithm-based
projectile and FS = 1.2 in JH-2 damage model for the SiC ceramic were determined
based on the tests of S10 and C6, respectively. Lastly, the simulations of C11 and
S5/C6 scenarios were conducted based on the determined numerical parameters.
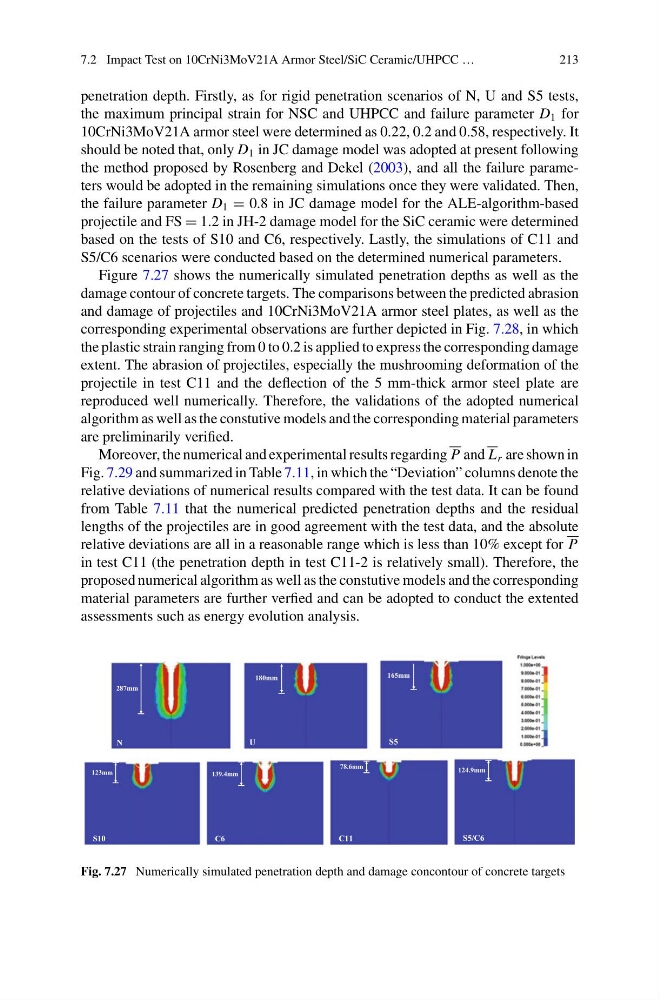
Figure 7.27 shows the numerically simulated penetration depths as well as the
damage contour of concrete targets. The comparisons between the predicted abrasion
and damage of projectiles and 10CrNi3MoV21A armor steel plates, as well as the
corresponding experimental observations are further depicted in Fig. 7.28, in which
the plastic strain ranging from 0 to 0.2 is applied to express the corresponding damage
extent. The abrasion of projectiles, especially the mushrooming deformation of the
projectile in test C11 and the deflection of the 5 mm-thick armor steel plate are
reproduced well numerically. Therefore, the validations of the adopted numerical
algorithm as well as the constutive models and the corresponding material parameters
are preliminarily verified.
Moreover, the numerical and experimental results regarding P and L r are shown in
Fig. 7.29 and summarized in Table 7.11, in which the “Deviation” columns denote the
relative deviations of numerical results compared with the test data. It can be found
from Table 7.11 that the numerical predicted penetration depths and the residual
lengths of the projectiles are in good agreement with the test data, and the absolute
relative deviations are all in a reasonable range which is less than 10% except for P
in test C11 (the penetration depth in test C11-2 is relatively small). Therefore, the
proposed numerical algorithm as well as the constutive models and the corresponding
material parameters are further verfied and can be adopted to conduct the extented
assessments such as energy evolution analysis.
287mm
N
180mm
U
165mm
S5
123mm
S10
139.4mm
C6
78.6mm
C11
124.9mm
S5/C6
Fig. 7.27 Numerically simulated penetration depth and damage concontour of concrete targets
213
penetration depth. Firstly, as for rigid penetration scenarios of N, U and S5 tests,
the maximum principal strain for NSC and UHPCC and failure parameter D 1 for
10CrNi3MoV21A armor steel were determined as 0.22, 0.2 and 0.58, respectively. It
should be noted that, only D 1 in JC damage model was adopted at present following
the method proposed by Rosenberg and Dekel (2003), and all the failure parameters would be adopted in the remaining simulations once they were validated. Then,
the failure parameter D 1 = 0.8 in JC damage model for the ALE-algorithm-based
projectile and FS = 1.2 in JH-2 damage model for the SiC ceramic were determined
based on the tests of S10 and C6, respectively. Lastly, the simulations of C11 and
S5/C6 scenarios were conducted based on the determined numerical parameters.
Figure 7.27 shows the numerically simulated penetration depths as well as the
damage contour of concrete targets. The comparisons between the predicted abrasion
and damage of projectiles and 10CrNi3MoV21A armor steel plates, as well as the
corresponding experimental observations are further depicted in Fig. 7.28, in which
the plastic strain ranging from 0 to 0.2 is applied to express the corresponding damage
extent. The abrasion of projectiles, especially the mushrooming deformation of the
projectile in test C11 and the deflection of the 5 mm-thick armor steel plate are
reproduced well numerically. Therefore, the validations of the adopted numerical
algorithm as well as the constutive models and the corresponding material parameters
are preliminarily verified.
Moreover, the numerical and experimental results regarding P and L r are shown in
Fig. 7.29 and summarized in Table 7.11, in which the “Deviation” columns denote the
relative deviations of numerical results compared with the test data. It can be found
from Table 7.11 that the numerical predicted penetration depths and the residual
lengths of the projectiles are in good agreement with the test data, and the absolute
relative deviations are all in a reasonable range which is less than 10% except for P
in test C11 (the penetration depth in test C11-2 is relatively small). Therefore, the
proposed numerical algorithm as well as the constutive models and the corresponding
material parameters are further verfied and can be adopted to conduct the extented
assessments such as energy evolution analysis.
287mm
N
180mm
U
165mm
S5
123mm
S10
139.4mm
C6
78.6mm
C11
124.9mm
S5/C6
Fig. 7.27 Numerically simulated penetration depth and damage concontour of concrete targets